



TL;DR: Profitable swing trading strategies for NSE stocks involve identifying and capitalizing on price swings lasting a few days to weeks, using tools like trend lines, support/resistance, and momentum indicators to enter and exit trades near swing highs and lows for optimal gains.
Key Stats at a Glance:
- NSE Average Daily Turnover: Over ₹1 lakh crore (as of early 2024).
- Nifty 50 Volatility Index (VIX): Historically ranges from 15 to 30, offering swing opportunities.
- Typical Swing Trade Holding Period: 2 days to 3 weeks.
- Average Swing Profit Target: 5-15% per trade.
- Number of Stocks on NSE: Over 4,000.
What is Swing Trading in the Indian Stock Market?
Swing trading in the Indian stock market is a trading strategy focused on capturing price gains over a period of a few days to several weeks, aiming to profit from short-to-medium term price movements (swings) of stocks listed on exchanges like the NSE.
Swing trading occupies a middle ground between the short-term focus of day trading and the long-term perspective of position trading. Swing traders aim to identify and capitalize on ‘swings’ in stock prices, which are the upward and downward movements that occur over a few days to a few weeks. Unlike day traders who close all positions before the market closes, swing traders hold positions overnight and over weekends, seeking to profit from significant price fluctuations. This approach requires a keen understanding of technical analysis to spot potential entry and exit points, as well as risk management to protect capital during adverse price movements. The NSE, with its diverse range of stocks and periods of increased volatility, offers fertile ground for implementing various swing trading strategies.

Swing Trading vs. Day Trading vs. Position Trading
Swing trading differs from day trading by its longer holding periods (days/weeks vs. intraday) and from position trading by its shorter timeframe (weeks/months vs. months/years), focusing on capturing intermediate price trends.
Key Characteristics of Swing Trading
Swing traders leverage technical indicators, chart patterns, and market sentiment to identify potential trades, aiming to capture a significant portion of a price move rather than trying to profit from every small fluctuation. They are less concerned with minor daily noise and more focused on the larger trend established over several trading sessions.
How Can I Identify Profitable Swing Trading Opportunities on the NSE?
Profitable swing trading opportunities on the NSE can be identified by analysing price action for clear trends, using support and resistance levels, and employing momentum indicators to signal potential reversals or continuations.
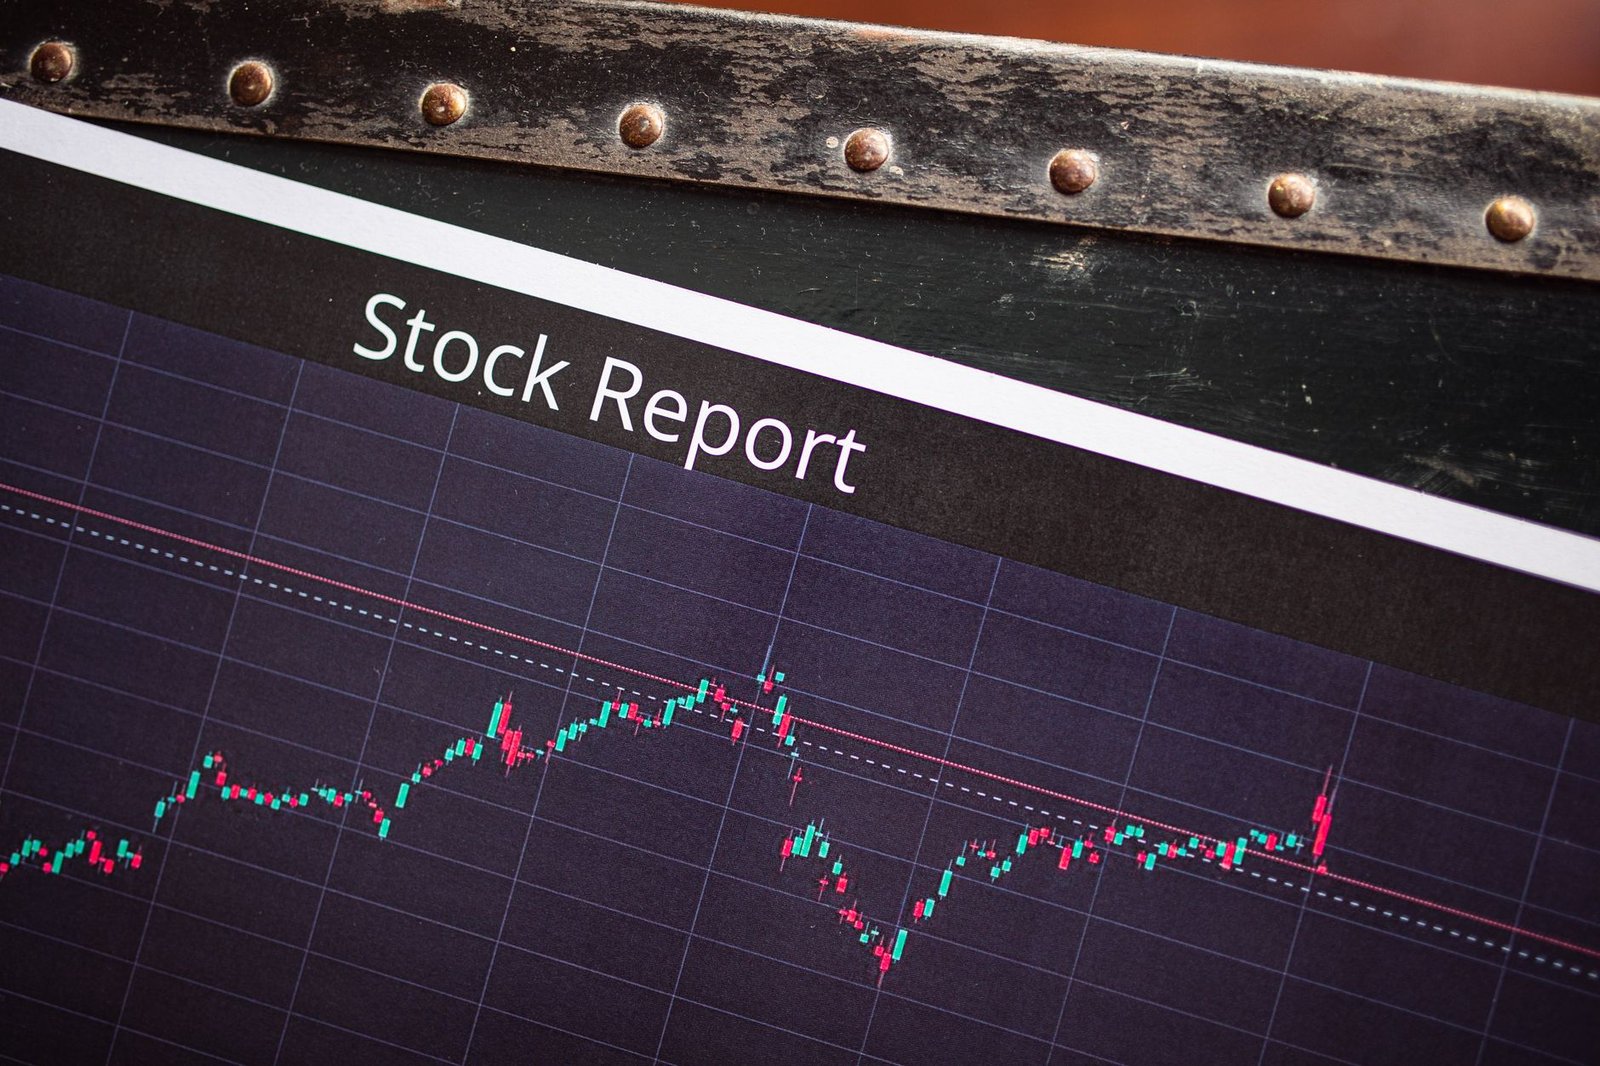
Identifying the right opportunities is paramount for successful swing trading. This involves a systematic approach to chart analysis. Firstly, traders look for stocks exhibiting clear trends – either upward (uptrend) or downward (downtrend). Within these trends, they seek points where the price is likely to reverse or pause, creating a ‘swing’. Key tools include drawing trend lines, identifying horizontal support and resistance zones, and observing candlestick patterns that suggest a shift in momentum. For instance, a stock in an uptrend might pull back to a support level, presenting a potential long entry. Conversely, a stock nearing a resistance level might offer a shorting opportunity if bearish signals emerge. Momentum oscillators like the Relative Strength Index (RSI) or MACD can help confirm these potential turning points, indicating whether a stock is overbought or oversold, which often precedes a price swing.
Utilizing Support and Resistance Levels
Support levels act as price floors where buying interest typically overcomes selling pressure, while resistance levels are price ceilings where selling pressure often emerges, creating natural boundaries for price swings.
Recognizing Chart Patterns
Patterns like ‘Head and Shoulders’, ‘Double Tops/Bottoms’, and ‘Flags/Pennants’ provide visual cues on price charts that often precede significant price movements, crucial for swing traders.
Employing Technical Indicators
Indicators such as Moving Average Convergence Divergence (MACD), RSI, and Stochastic Oscillator help gauge momentum, identify overbought/oversold conditions, and confirm trend strength.
Moving Averages for Trend Confirmation
Moving averages, particularly the 50-day and 200-day Simple Moving Averages (SMAs), are vital for confirming the prevailing trend direction and identifying potential support or resistance areas.
RSI for Overbought/Oversold Signals
The RSI helps traders determine if a stock’s price has moved too far, too fast, potentially indicating an imminent reversal or a pause in the current trend.
What Are the Most Effective Swing Trading Strategies for NSE Stocks?
The most effective swing trading strategies for NSE stocks often involve trend following, breakout trading, and reversal patterns, tailored to capture specific market dynamics and price actions.
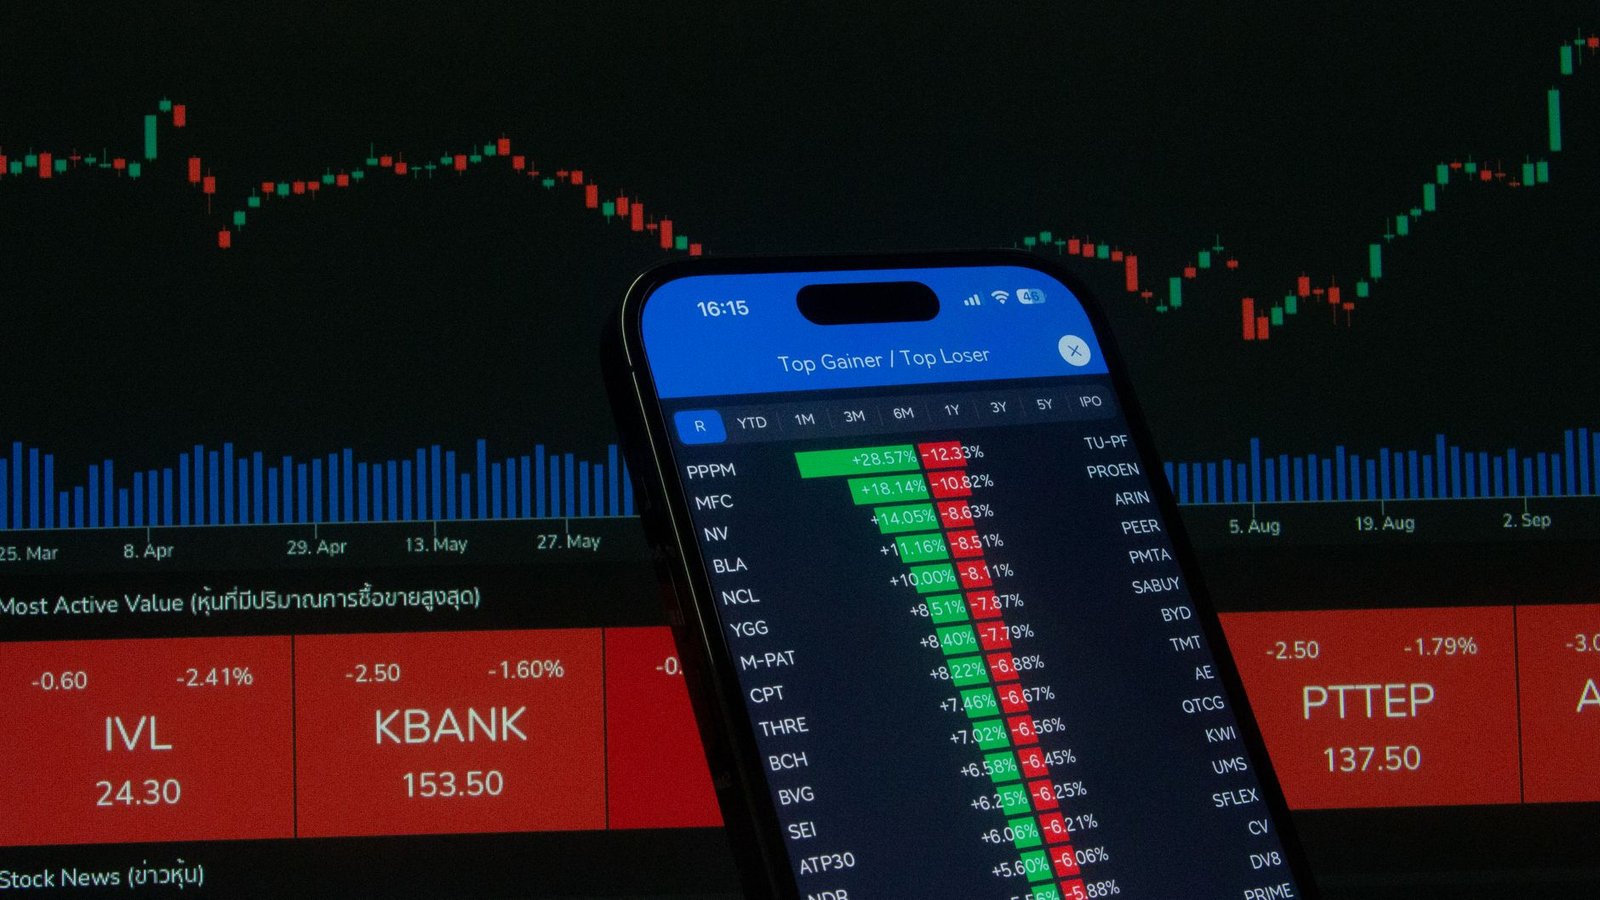
Several proven strategies can be employed effectively on the NSE. Trend following strategies involve identifying an established trend (up or down) and trading in the direction of that trend. This could involve entering a long position when a stock bounces off a rising moving average or a support level in an uptrend. Breakout trading focuses on identifying periods of consolidation where a stock price is coiling before a significant move. Traders look for the price to break decisively above resistance (for a long trade) or below support (for a short trade), expecting the momentum to continue in the breakout direction. Reversal strategies target the end of a trend, looking for signs that the price is about to change direction. This often involves identifying specific candlestick patterns (like engulfing patterns or dojis) or chart patterns (like double tops/bottoms) at key price levels, signalling a potential shift.
Trend Following Strategy
This strategy involves identifying the dominant trend (uptrend or downtrend) and trading in that direction, often using moving averages or trend lines as guides.
Breakout Trading Strategy
Traders aim to profit from the increased momentum following a stock’s price moving beyond a defined level of support or resistance.
Reversal Trading Strategy
This involves anticipating and trading upon the potential end of a prevailing trend, often using specific chart patterns or candlestick formations.
Using Support/Resistance with Trend Lines
Combining horizontal support/resistance levels with diagonal trend lines provides a robust framework for identifying entry and exit points within a trend.
Candlestick Patterns for Reversals
Specific Japanese candlestick patterns, such as the ‘Hammer’, ‘Shooting Star’, and ‘Engulfing’ patterns, are powerful signals for potential trend reversals.
Momentum Trading Strategy
This strategy focuses on stocks that are already moving strongly in one direction, anticipating that the momentum will continue for a short period.
How Do I Manage Risk Effectively in Swing Trading NSE Stocks?
Effective risk management in swing trading NSE stocks is crucial and involves setting strict stop-loss orders, determining appropriate position sizes, and never risking more than a small percentage of trading capital on any single trade.
Risk management is arguably the most critical component of successful swing trading. Without it, even the best strategies can lead to significant losses. The cornerstone of risk management is the stop-loss order. A stop-loss is an order placed with a broker to buy or sell a security when it reaches a certain price, intended to limit an investor’s loss on a security transaction. For swing traders, this is typically placed just below a key support level for a long position or just above a key resistance level for a short position. Secondly, position sizing is vital. This refers to the number of shares or contracts to trade based on the stop-loss distance and the amount of capital one is willing to risk. A common guideline is to risk no more than 1-2% of total trading capital per trade. Diversification across different stocks and sectors can also help mitigate risk, preventing overexposure to any single asset. Discipline in adhering to these rules, even during losing streaks, is key to long-term survival and profitability.
Setting Stop-Loss Orders
Always define your maximum acceptable loss before entering a trade and place a stop-loss order accordingly to protect your capital.
Determining Position Size
Calculate the number of shares to trade based on your risk tolerance (e.g., 1-2% of capital) and the distance to your stop-loss.
Diversification
Avoid concentrating all your capital into a single stock or sector; spread your investments to reduce overall portfolio risk.
Trailing Stops
As a trade moves in your favor, consider using trailing stop-loss orders to lock in profits while still allowing for further upside potential.
Reviewing and Adjusting Trades
Regularly review your trade performance to identify patterns in both winning and losing trades, and adjust your strategy and risk parameters as needed.
Frequently Asked Questions
What is the best time frame for swing trading NSE stocks?
The ideal timeframe for swing trading NSE stocks typically ranges from daily charts to 4-hour charts, allowing capture of price movements spanning a few days to a couple of weeks.
Should I use fundamental or technical analysis for swing trading?
Swing trading primarily relies on technical analysis to identify entry/exit points and trends. However, understanding basic fundamentals can help avoid trading stocks with significant upcoming negative news.
How much capital is needed to start swing trading?
While you can start with a smaller amount, having sufficient capital to implement proper risk management (e.g., ₹50,000 – ₹1 lakh or more) allows for better position sizing and diversification.
What are the common mistakes swing traders make?
Common mistakes include poor risk management, emotional trading, overtrading, not having a clear strategy, and failing to adhere to stop-loss levels.
How long does a typical swing trade last?
A typical swing trade can last anywhere from a few days to a few weeks, depending on the speed of price movement and the strategy employed.
Can I swing trade during high volatility market conditions?
Yes, high volatility can present more opportunities for swing traders, but it also requires tighter risk management and more cautious position sizing.
How to Get Started with Swing Trading NSE Stocks
- Educate Yourself: Thoroughly understand the principles of technical analysis, chart patterns, and indicators.
- Choose a Broker: Select a SEBI-registered broker offering a reliable trading platform with charting tools. Consider platforms offering advanced TradingView indicators for detailed analysis.
- Develop a Trading Plan: Define your strategy, risk tolerance, entry/exit rules, and money management techniques.
- Backtest Your Strategy: Test your chosen strategy on historical data to assess its potential profitability and identify weaknesses.
- Start with a Demo Account: Practice your strategy in a risk-free simulated trading environment.
- Begin with Small Capital: Once confident, start trading with a small amount of real capital you can afford to lose.
- Implement Strict Risk Management: Always use stop-loss orders and appropriate position sizing for every trade.
- Review and Refine: Continuously analyze your trades, learn from mistakes, and adapt your strategy as market conditions evolve.
Key Takeaways:
- Swing trading aims to capture short-to-medium term price movements (days to weeks) in NSE stocks.
- Effective strategies include trend following, breakout trading, and reversal patterns, supported by technical analysis.
- Identifying clear trends, support/resistance levels, and using momentum indicators are crucial for finding opportunities.
- Strict risk management, including stop-loss orders and proper position sizing, is essential for capital preservation.
- Continuous learning, backtesting, and disciplined execution are vital for long-term success in swing trading.
- Leveraging advanced tools like a TradingView indicator can enhance analytical capabilities for swing traders.
All investments in securities are subject to market risks. Read all related documents carefully before investing. Past performance is not indicative of future results.






 Finovatives