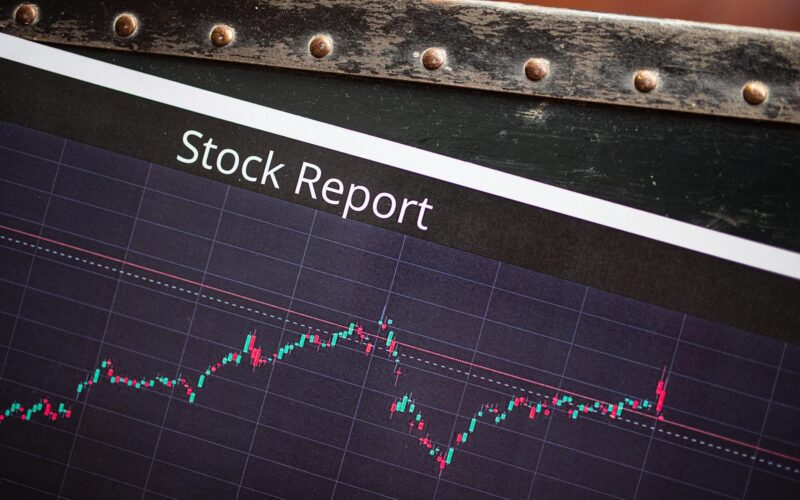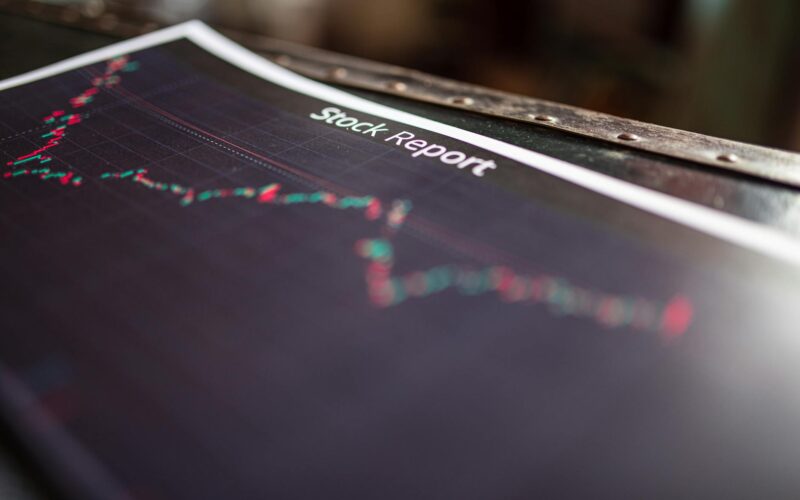
Decoding India’s Market Pulse: Nifty 50, Sensex, and Bank Nifty
The Indian stock market, a dynamic arena of opportunity and risk, often feels like a vast ocean to new traders and investors. However, understanding its overall health and direction can be significantly simplified by grasping the concept of market indices. These indices act as barometers, reflecting the performance of a specific segment or the entire market. For anyone navigating the National Stock Exchange (NSE) and the Bombay Stock Exchange (BSE), a firm understanding of key indices like the Nifty 50, Sensex, and Bank Nifty is not just beneficial but essential. In this article, we will delve deep into what these indices represent, how they are constructed, and most importantly, how you, as an Indian trader or investor, can leverage this knowledge for more informed decision-making.
What are Market Indices and Why Do They Matter?
At its core, a market index is a statistical measure designed to track the performance of a group of securities, such as stocks. Think of it as a representative basket of shares that collectively mirrors a particular market segment. For instance, the Nifty 50 represents the top 50 large-cap stocks listed on the NSE, while the Sensex comprises 30 blue-chip companies on the BSE.
Indices are crucial for several reasons:
- Market Benchmarking: They serve as a benchmark against which the performance of individual stocks, mutual funds, and investment portfolios can be compared. If your investment portfolio grows by 15% in a year and the Nifty 50 grew by 20%, it suggests your portfolio underperformed the broader market.
- Economic Indicator: A rising index generally signals a healthy economy and investor confidence, while a falling index might indicate economic slowdowns or uncertainty.
- Investment Vehicles: Indices form the basis for passive investment strategies through index funds and Exchange Traded Funds (ETFs). These funds aim to replicate the performance of a specific index, offering diversification at a lower cost.
- Trading Instruments: Derivatives like futures and options are actively traded on major indices, providing traders with tools to hedge their positions or speculate on market movements.
Understanding these indices helps you gauge market sentiment, identify trends, and make strategic investment or trading decisions. For instance, if the Nifty 50 is on an upward trajectory, it generally indicates positive market sentiment, making it potentially a good time to explore long positions in fundamentally strong stocks.
The Pillars of the Indian Market: Nifty 50 and Sensex
The Nifty 50 and the Sensex are the two most widely followed equity indices in India, representing the large-cap segment of the Indian stock market. While both serve a similar purpose, they operate on different exchanges and have distinct methodologies.
The Nifty 50: NSE’s Flagship Index
The Nifty 50, managed by India Index Services and Products Ltd. (IISL), a subsidiary of the NSE, is the benchmark equity index of the National Stock Exchange. It comprises 50 of the largest and most liquid Indian companies listed on the NSE, representing about 13 sectors of the economy. The Nifty 50 is a free-float market capitalization-weighted index. This means that the weight of a company in the index is determined by its market capitalization, adjusted for the number of shares that are readily available for trading in the public market (the free float).
Calculation: The index value is calculated based on the total free-float market value of its constituent stocks relative to a base period. The base period for Nifty 50 is November 3, 1995, with a base value of 1000.
Importance for Traders: The Nifty 50 is heavily traded in both the spot and derivatives markets (futures and options). Many traders use its movements to gauge overall market direction. For example, a break above a significant resistance level on the Nifty 50 chart might encourage traders to look for buying opportunities in sectors that are performing well.
The Sensex: BSE’s Iconic Index
The Sensex (Sensitive Index), managed by the Bombay Stock Exchange (BSE), is India’s oldest and most well-known stock market index. It comprises 30 well-established and financially sound companies listed on the BSE, representing a wide spectrum of Indian industries. Like the Nifty 50, the Sensex is also a free-float market capitalization-weighted index.
Calculation: The Sensex was launched on January 2, 1986, with a base value of 100. Its calculation is also based on the free-float market capitalization of its constituent stocks. The BSE employs a methodology that adjusts for free float and also rebalances the index semi-annually.
Why Two Major Indices? While both indices represent large-cap Indian companies, they differ in their constituents and the exchange they are listed on. The Nifty 50, with 50 stocks, offers slightly broader diversification compared to the Sensex’s 30 stocks. However, both are highly correlated and generally move in tandem, reflecting the broader trends in the Indian equity market.
Bank Nifty: A Focused Sectoral Index
While the Nifty 50 and Sensex provide a broad overview of the Indian market, the Bank Nifty offers a more focused view on a crucial sector of the Indian economy: banking. The Bank Nifty is the benchmark index for the banking sector, comprising the top 12 most liquid and large-cap Indian banking stocks listed on the NSE.
Composition: It includes a mix of public sector banks (PSBs) and private sector banks, reflecting the diversity within India’s financial landscape. Examples include HDFC Bank, ICICI Bank, State Bank of India, Kotak Mahindra Bank, and Axis Bank.
Calculation: Similar to the Nifty 50, the Bank Nifty is also a free-float market capitalization-weighted index. Its base value is 1000, and the base period is January 1, 2000.
Significance for Traders: The banking sector plays a pivotal role in India’s economic growth, acting as a conduit for credit and investment. Therefore, the Bank Nifty is a highly watched index, particularly by traders who specialize in financial stocks. Significant news or policy changes impacting the banking sector (e.g., interest rate hikes by the Reserve Bank of India (RBI), changes in Non-Performing Asset (NPA) norms) can lead to sharp movements in the Bank Nifty. The Bank Nifty often exhibits higher volatility compared to the Nifty 50 due to the concentrated nature of its constituents and the inherent cyclicality of the banking business.
For instance, during periods of economic expansion, banks tend to benefit from increased loan demand and lower NPAs, pushing the Bank Nifty higher. Conversely, during economic downturns, rising NPAs and reduced credit off-take can put pressure on the index.
Practical Application for Indian Traders and Investors
Understanding these indices is not just an academic exercise; it has direct practical implications for your trading and investment strategies on the NSE and BSE.
Using Indices for Market Analysis
Trend Identification: Observing the charts of Nifty 50, Sensex, and Bank Nifty can provide valuable insights into the overall market trend. Are we in a bull market (uptrend), a bear market (downtrend), or a period of consolidation? This broad market view helps in deciding whether to take a bullish or bearish stance on individual stocks.
Sectoral Insights: The Bank Nifty’s performance relative to the Nifty 50 can indicate the strength of the banking sector. If the Bank Nifty is outperforming the Nifty 50, it suggests that banks are leading the market rally, and traders might consider focusing on banking stocks. Conversely, if the Nifty 50 is rising but the Bank Nifty is lagging, it might indicate that other sectors are driving the market.
Volatility Assessment: The VIX (Volatility Index), often called the ‘fear gauge’ of the Indian market, is derived from the Nifty options prices. A rising VIX suggests increasing market volatility and uncertainty, often associated with market downturns. Traders might use this information to adjust their position sizing or adopt more cautious strategies.
Example: Imagine the Nifty 50 is trading near its all-time high, showing strong upward momentum. Simultaneously, the Bank Nifty is also showing a similar bullish trend, with major banks like HDFC Bank and ICICI Bank reporting strong quarterly results. This confluence of signals would encourage a trader to look for bullish setups in banking stocks, potentially using technical indicators like the Moving Average Convergence Divergence (MACD) or Relative Strength Index (RSI) on individual stock charts to pinpoint entry points.
Trading and Investing Strategies
Index Futures and Options: Many traders use Nifty and Bank Nifty futures and options to speculate on short-term market movements or to hedge their existing equity portfolios. For instance, if an investor holds a large portfolio of stocks that mirrors the Nifty 50 and anticipates a short-term market correction, they could sell Nifty futures or buy Nifty put options to protect against potential losses.
Index Funds and ETFs: For long-term investors, index funds and ETFs that track the Nifty 50 or Sensex offer a simple and cost-effective way to gain diversified exposure to the broader market. These are particularly suitable for retail investors who may lack the time or expertise to select individual stocks. Mutual fund houses like UTI, ICICI Prudential, and HDFC AMC offer such products.
Sectoral Bets: Investors bullish on the banking sector can invest in Bank Nifty index funds or ETFs, or even trade Bank Nifty derivatives. However, it’s crucial to remember that sectoral indices are generally more volatile than broad-market indices.
Risk Management and Key Considerations
While indices provide valuable insights, it’s essential to approach trading and investing with a robust risk management framework. The Indian stock market, regulated by the Securities and Exchange Board of India (SEBI), is subject to various domestic and global factors.
Diversification: Never put all your eggs in one basket. Even when investing in index-tracking products, understand that they represent specific market segments. Diversifying across different asset classes (equity, debt, gold) and geographies can mitigate risk.
Understanding Leverage: Trading in index futures and options involves significant leverage, which can amplify both profits and losses. Ensure you fully understand the risks associated with these instruments before trading them. SEBI has implemented various measures, including margin requirements and position limits, to manage systemic risk in the derivatives segment.
Economic Factors: Keep an eye on macroeconomic indicators such as inflation rates, GDP growth, RBI’s monetary policy decisions, and global economic events. These factors can significantly impact the performance of indices like the Nifty 50, Sensex, and especially the Bank Nifty.
Market Sentiment: Indices are also influenced by market sentiment, which can be driven by news, corporate actions, and even social media trends. While fundamental analysis is crucial for long-term investing, understanding market sentiment can be vital for short-term trading.

For instance, a sudden geopolitical event or an unexpected inflation print can lead to sharp, unpredictable movements in the indices. Traders must employ stop-loss orders diligently to limit potential downside on their derivative positions.
Key Takeaways
- Market indices like Nifty 50, Sensex, and Bank Nifty are crucial barometers of the Indian stock market’s performance.
- Nifty 50 (NSE) and Sensex (BSE) represent the large-cap segment, comprising 50 and 30 companies respectively, and are free-float market capitalization-weighted.
- Bank Nifty focuses on the banking sector, including 12 key banking stocks, and is often more volatile than broad-market indices.
- Indices are used for benchmarking, economic indication, and as underlying assets for investment products (index funds, ETFs) and derivatives (futures, options).
- Traders and investors can use index analysis for trend identification, sectoral insights, and volatility assessment.
- Effective risk management, including diversification and understanding leverage, is paramount when trading or investing based on index movements.
Disclaimer: The information provided in this article is for educational purposes only and should not be considered as financial advice. Investing in the stock market involves risks, including the potential loss of principal. Consult with a qualified financial advisor before making any investment decisions. Finovatives.com and its affiliates are not responsible for any trading or investment decisions made based on the information presented herein.
Frequently Asked Questions
What's the main difference between Nifty 50 and Sensex for Indian investors?
The Nifty 50 tracks 50 large-cap stocks on the NSE, while the Sensex tracks 30 blue-chip stocks on the BSE. Both are key benchmarks, but Nifty 50 represents a broader selection of India's top companies listed on the National Stock Exchange.
How does Bank Nifty help in trading Indian financial stocks?
Bank Nifty comprises the top 12 most liquid and large Indian banking stocks listed on the NSE. It's a crucial index for traders looking to gauge the sentiment and performance of the Indian banking sector, which significantly influences the broader market.
Can I invest directly in Nifty 50 or Sensex?
You cannot invest directly in an index. However, you can invest in index funds or ETFs that aim to replicate the performance of Nifty 50 or Sensex. This provides diversified exposure to India's leading stocks with a single investment.
What does a rising Nifty 50 indicate for my investments in India?
A rising Nifty 50 generally suggests a positive market sentiment and economic growth in India. It indicates that the top 50 companies on the NSE are performing well, which can be a good sign for the overall equity market and potentially your portfolio.
How are these Indian market indices calculated?
Indices like Nifty 50 and Sensex are typically weighted by market capitalization. This means larger companies have a greater influence on the index's movement. The exact calculation methodology ensures they accurately reflect the performance of their constituent stocks on the NSE or BSE.