TL;DR: Effective intraday trading strategies for the Indian stock market involve quick decision-making based on technical analysis, focusing on short-term price movements to capture profits within a single trading session.
Key Stats at a Glance:
- NSE daily trading volume often exceeds ₹1 lakh crore.
- Nifty 50 Index comprises 50 of India’s largest companies.
- Average intraday volatility in select Indian stocks can exceed 5% on active days.
- Over 60% of retail trading volume in India occurs within the derivatives segment.
- SEBI mandates strict risk management and margin rules for intraday traders.
What are the top intraday trading strategies for the Indian stock market?
Top intraday trading strategies for the Indian stock market are systematic approaches designed to profit from price fluctuations within a single trading day, utilizing tools like technical indicators and chart patterns.
Scalping
Scalping is an aggressive strategy focused on making numerous small profits from tiny price changes throughout the day. Scalpers aim to exit trades within seconds or minutes, relying on high trade frequency and tight risk management. This requires intense concentration and rapid execution, often utilising leverage to magnify small gains. Key to scalping is identifying highly liquid stocks with tight bid-ask spreads to minimize transaction costs and slippage.
Momentum Trading
Momentum trading involves identifying stocks that are moving strongly in a particular direction and jumping aboard the trend. Traders look for stocks exhibiting significant price increases or decreases with high volume, expecting the momentum to continue in the short term. Entry and exit points are crucial, often determined by breakout patterns or indicator signals, with stop-losses placed to protect against trend reversals. This strategy thrives in trending markets.
Breakout Trading
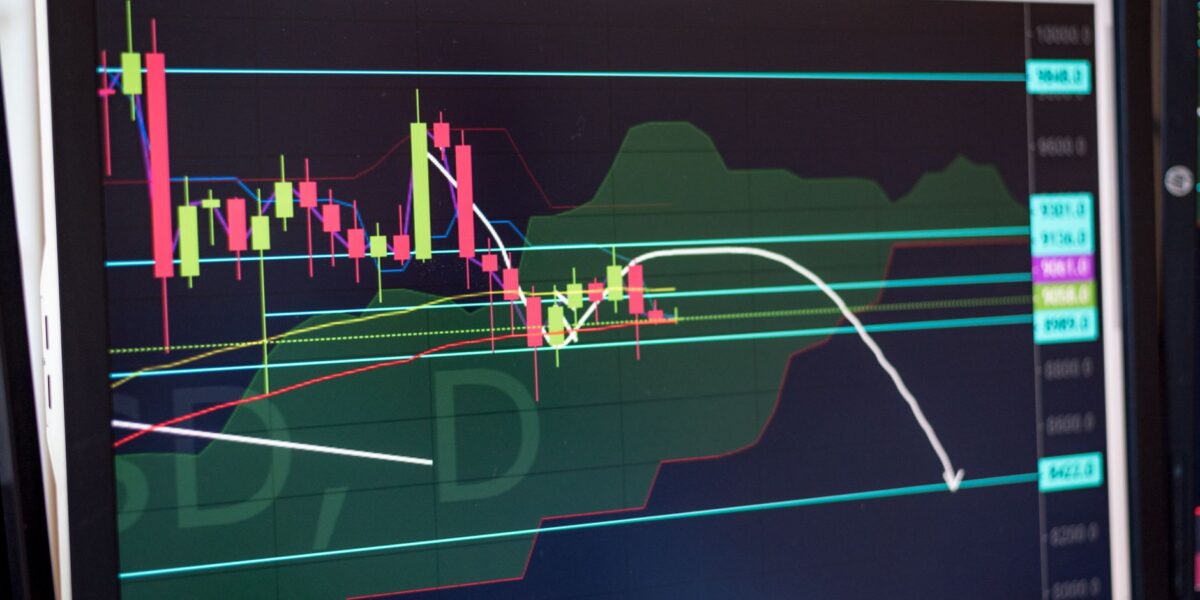
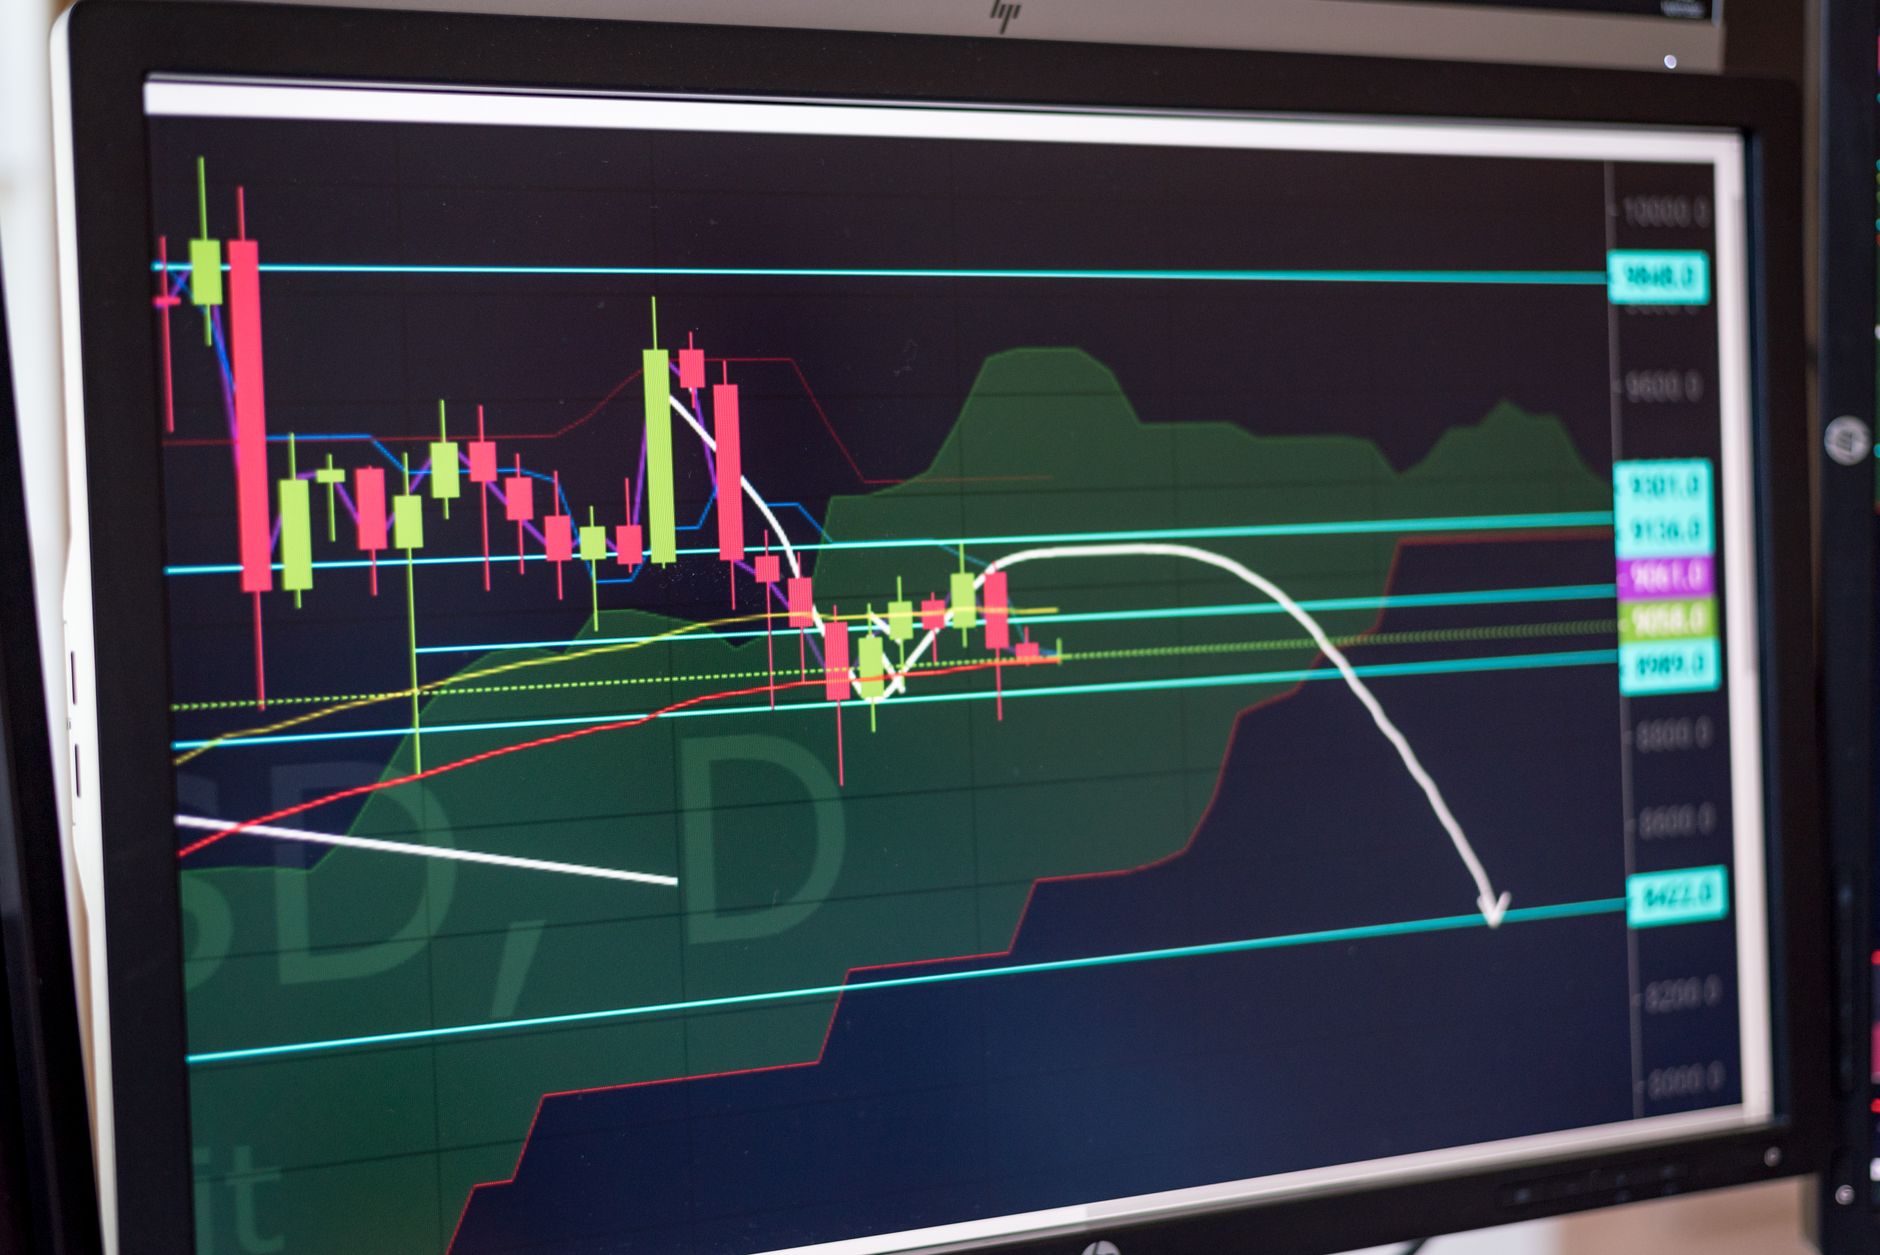
Breakout trading capitalizes on stocks moving out of a defined price range or pattern, such as a consolidation triangle or a resistance/support level. Traders enter a position when the price decisively moves beyond these boundaries, anticipating a sustained directional move. Confirmation of the breakout, often with increased volume, is essential to avoid false signals. Risk management involves setting stop-losses just beyond the breakout level.
Trading with Pivot Points
Pivot points are technical indicators calculated based on the previous day’s high, low, and closing prices. They help identify potential support and resistance levels for the current trading day. Intraday traders use these levels to anticipate price reversals or continuations, entering trades when the price interacts with a pivot, support, or resistance level. Many traders also use indicators like the Moving Average Convergence Divergence (MACD) in conjunction with pivot points.
What technical indicators are most useful for intraday traders?
The most useful technical indicators for intraday traders provide real-time insights into price action, momentum, and potential turning points, enabling quick and informed trading decisions.
Moving Average Convergence Divergence (MACD)
The MACD is a trend-following momentum indicator that shows the relationship between two moving averages of a security’s price. It consists of the MACD line, signal line, and histogram. Crossovers between the MACD line and signal line can signal potential buy or sell opportunities, while the histogram visually represents the divergence between the two lines. It’s particularly effective in identifying shifts in momentum.
Relative Strength Index (RSI)
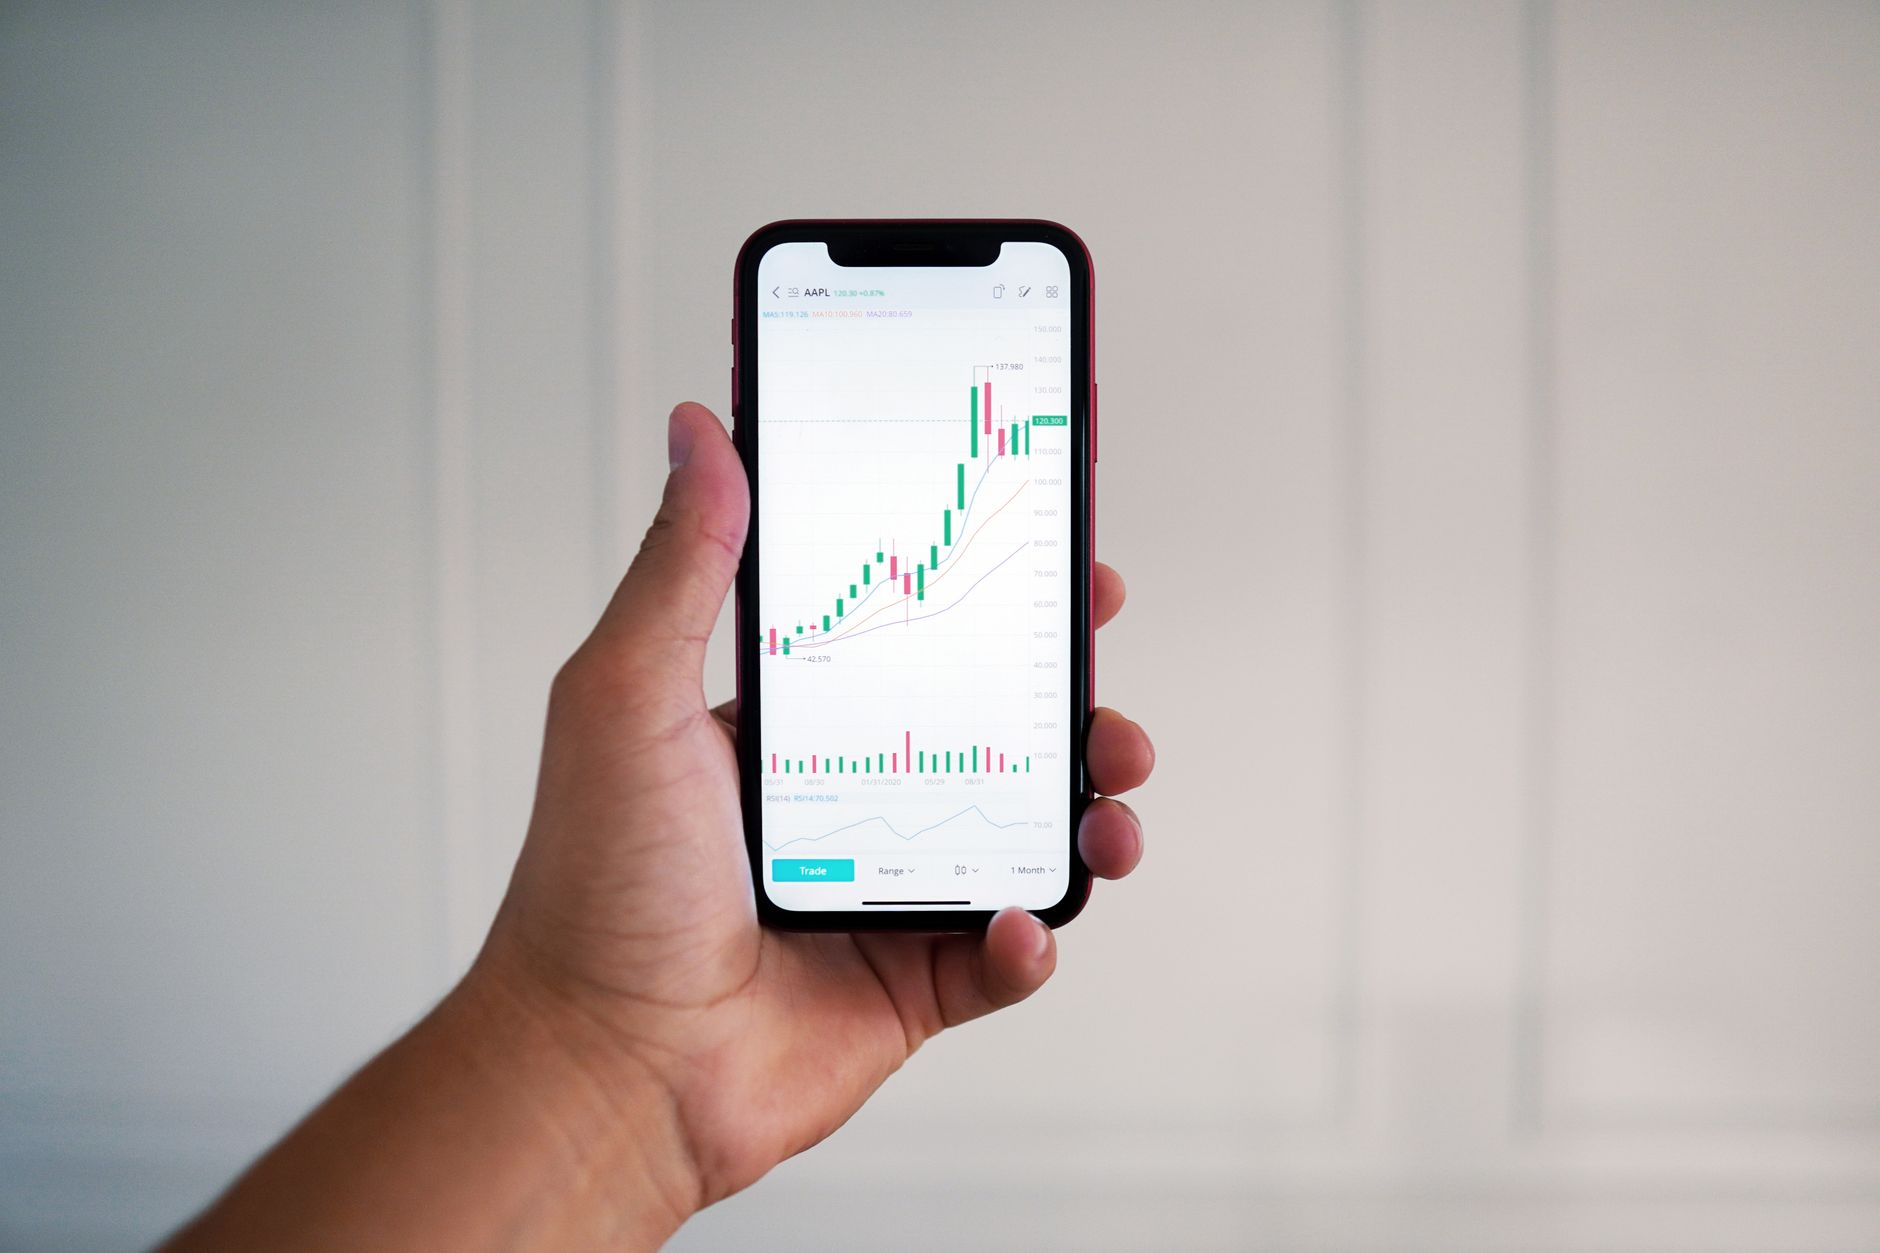
The RSI is a momentum oscillator that measures the speed and change of price movements. It oscillates between 0 and 100 and is typically used to identify overbought or oversold conditions. Readings above 70 are generally considered overbought, suggesting a potential price pullback, while readings below 30 indicate oversold conditions, hinting at a possible price rebound. Intraday traders often use it to find opportune entry or exit points.
Volume Analysis
Volume analysis involves studying the number of shares traded during a specific period. High volume accompanying a price move often suggests strong conviction behind that move, making it more likely to continue. Conversely, a price move on low volume might be less sustainable. Intraday traders use volume to confirm breakouts, identify potential trend reversals, and gauge market interest in a particular stock.
Bollinger Bands
Bollinger Bands consist of a middle band (a simple moving average) and two outer bands plotted at a standard deviation away from the middle band. They are used to measure volatility and identify potential overbought or oversold conditions. When the bands narrow, it indicates low volatility and potential for a significant price move; when they widen, volatility is high. Prices touching the outer bands can signal potential reversals.
How can I effectively manage risk in intraday trading?
Effective risk management in intraday trading is paramount for capital preservation and sustained profitability, involving pre-defined rules and disciplined execution.
How to implement a stop-loss order
- Determine your maximum acceptable loss per trade, typically a small percentage of your trading capital (e.g., 1-2%).
- Calculate the price level at which your loss would reach this maximum amount.
- For a long position, place a stop-loss order slightly below a key support level or your calculated entry point.
- For a short position, place a stop-loss order slightly above a key resistance level or your calculated entry point.
- Ensure the stop-loss is placed immediately after entering the trade to avoid emotional decisions.
- Regularly review and adjust stop-losses if necessary, but avoid moving them further against your position.
- Understand that stop-losses are not guaranteed to execute at the exact price in highly volatile markets (slippage may occur).
Position Sizing
Position sizing is crucial for managing risk. It involves determining how many shares or contracts to trade based on your account size, the stop-loss distance, and your risk tolerance per trade. A common rule is to risk no more than 1-2% of your total capital on any single trade. This ensures that a few losing trades do not decimate your account.
Diversification (within intraday context)
While full portfolio diversification isn’t an intraday concept, traders can diversify by trading multiple uncorrelated stocks or sectors simultaneously. This prevents a single bad trade or sector downturn from wiping out profits. However, it’s essential not to over-diversify, which can dilute focus and make execution difficult.
Understanding Leverage
Leverage, offered by brokers for intraday trading, magnifies both potential profits and losses. While it allows trading larger positions with less capital, it significantly increases risk. Intraday traders must use leverage cautiously, understanding its implications and ensuring their stop-loss orders are adequately placed to prevent margin calls and substantial losses.
Regular Review and Analysis
Consistently reviewing past trades, both winners and losers, is vital. Analyze the reasons behind your trades, the effectiveness of your chosen strategies, and the adherence to your risk management plan. This self-assessment helps identify patterns, refine strategies, and improve decision-making over time. Tools like the Trend Traders Tool can be invaluable for this analysis.
What are the common pitfalls for Indian intraday traders to avoid?
Indian intraday traders often fall prey to common psychological and strategic errors that can lead to significant losses and hinder long-term success.
Emotional Trading
Fear and greed are the biggest enemies of an intraday trader. Fear can cause premature exits from profitable trades or hesitation to enter good opportunities, while greed can lead to holding onto losing trades for too long or over-leveraging. Sticking to a pre-defined trading plan and strategy is the best defense against emotional decision-making.
Lack of a Trading Plan
Trading without a clear plan is like sailing without a map. A trading plan should outline your strategy, risk management rules, entry/exit criteria, the markets you’ll trade, and your financial goals. Without one, decisions become haphazard and reactive, increasing the likelihood of errors.
Ignoring Market News and Events
While intraday trading focuses on technicals, major news events (RBI policy, budget announcements, global economic shifts) can cause extreme volatility and unpredictable price swings. Ignoring these can lead to unexpected losses. Traders should be aware of the economic calendar and adjust their positions accordingly.
Over-trading
The desire to constantly be in a trade can lead to over-trading, where a trader takes too many positions, often with poor setups, simply to be active. This increases transaction costs and the probability of making mistakes. It’s better to wait for high-probability setups aligned with your strategy than to force trades.
Insufficient Capital
Under-capitalization is a common reason for failure. Intraday trading requires sufficient capital to withstand market fluctuations, manage risk effectively with proper position sizing, and cover brokerage and other charges. Trading with insufficient funds often leads to excessive risk-taking and emotional decisions when small losses occur.
Frequently Asked Questions
What is the best time for intraday trading in India?
The best time is typically between 9:15 AM and 10:30 AM IST, when the market opens with high volatility and volume after initial reactions to overnight news. The last hour of trading (3:00 PM to 4:00 PM IST) also offers good opportunities due to increased activity.
Is intraday trading profitable in India?
Yes, intraday trading can be profitable if done with a sound strategy, strict risk management, discipline, and continuous learning. However, it carries significant risk, and many retail traders incur losses.
How much capital is needed for intraday trading in India?
While technically one can start with a small amount (e.g., ₹5,000-₹10,000), a capital of ₹50,000 to ₹1 lakh is generally recommended for effective risk management and to trade with decent position sizes, especially after considering brokerage and taxes.
Which stocks are best for intraday trading?
Highly liquid stocks with high daily trading volumes and moderate volatility are best. Stocks from large-cap indices like the Nifty 50 and actively traded futures contracts are often preferred.
Can I use TradingView indicators for intraday strategies?
Absolutely. TradingView offers a vast array of indicators and charting tools perfectly suited for intraday analysis. Many popular strategies heavily rely on these indicators, and you can often find custom TradingView indicators developed for specific intraday approaches.
What is the most important aspect of intraday trading?
The most critical aspect is disciplined risk management. Protecting your capital through stop-losses and proper position sizing is more important than any single winning trade; it ensures you stay in the game to trade another day.
Key Takeaways:
- Intraday trading strategies focus on short-term price movements within a single trading session.
- Key strategies include scalping, momentum trading, breakout trading, and using pivot points.
- Essential technical indicators for intraday traders are MACD, RSI, Volume analysis, and Bollinger Bands.
- Strict risk management, including stop-loss orders and appropriate position sizing, is crucial for survival.
- Avoiding emotional trading, over-trading, and having a well-defined trading plan are vital for success.
- Awareness of market news and events is important, even for technically driven intraday strategies.
- Continuous learning and analysis of trading performance are key to long-term profitability.
Trading in the Indian stock market involves substantial risk and is not suitable for all investors. Ensure you understand the risks involved before trading.


 Finovatives