TL;DR: Support and resistance levels are price points where a stock’s trend is likely to pause or reverse, acting as ceilings and floors for price movements, crucial for making informed trading decisions.
Key Stats at a Glance:
- Nifty 50 has demonstrated an average annual return of over 12% in the last decade.
- BSE Sensex comprises 30 large, well-established companies.
- Over 5,000 companies are listed across NSE and BSE combined.
- Traders often use the 50-day and 200-day moving averages to identify dynamic support/resistance.
- Historically, significant price reversals have occurred at established support and resistance zones.
What are Support and Resistance Levels?
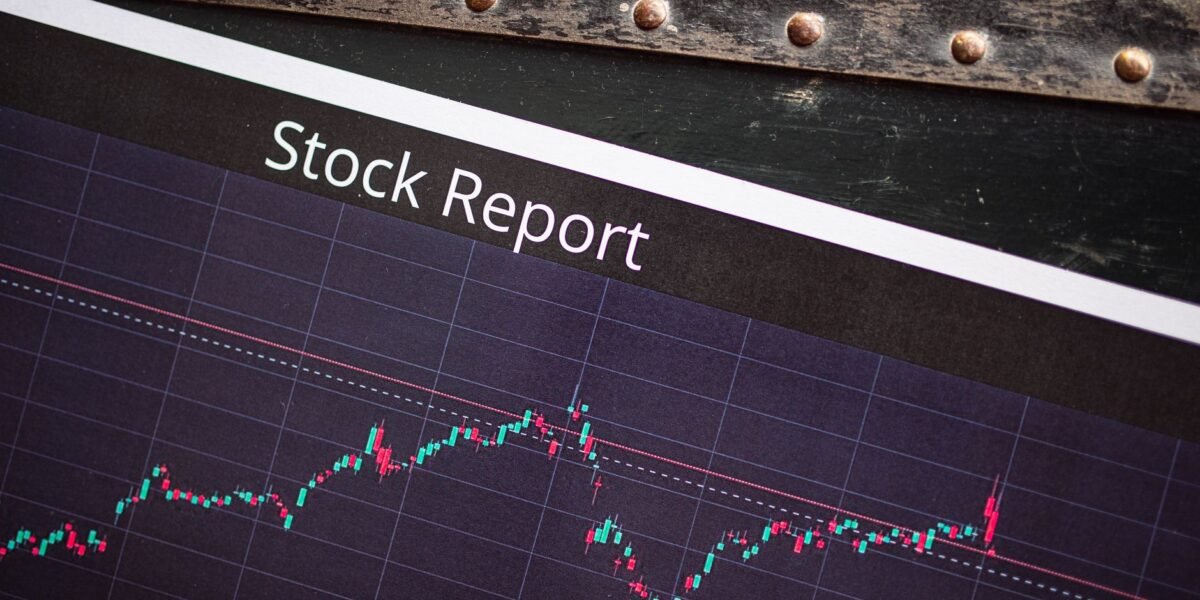
Support and resistance are fundamental concepts in technical analysis, representing price levels where a stock is expected to encounter buying pressure (support) or selling pressure (resistance), thereby hindering a price move in that direction.
Defining Support
Support is a price level where demand is strong enough to overcome supply, preventing the price from falling further. Think of it as a floor; once the price hits this level, buyers tend to step in, pushing it back up.
Defining Resistance
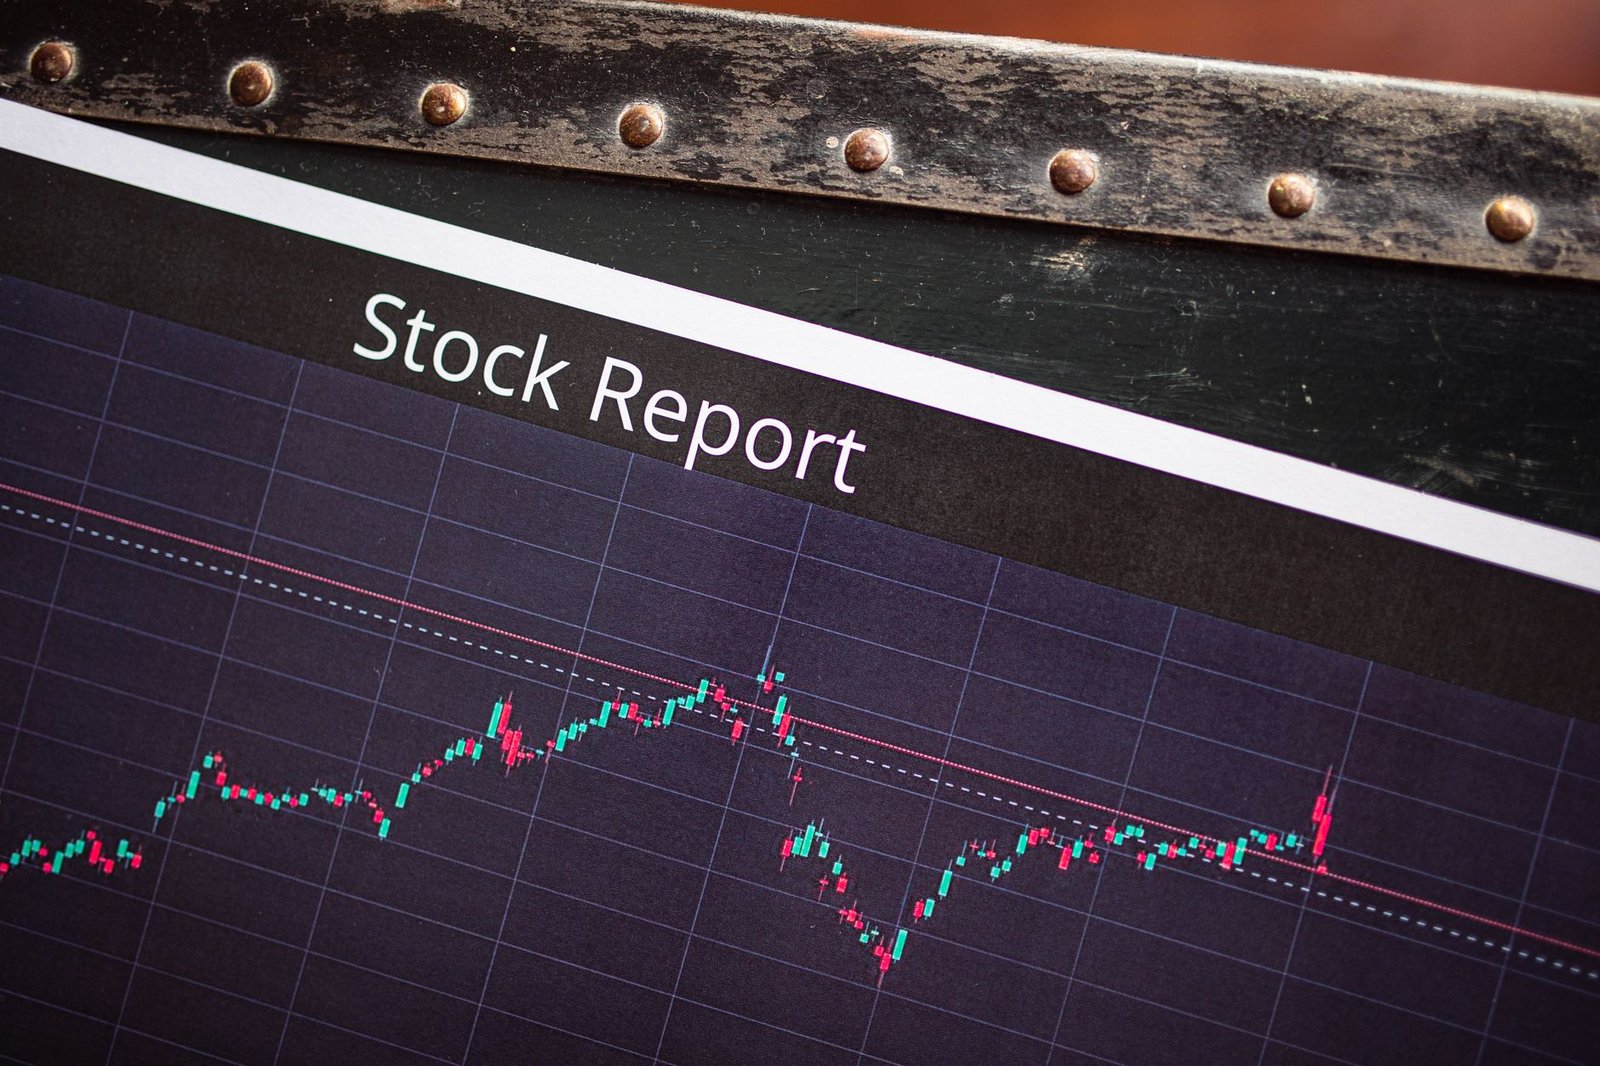
Resistance is the opposite of support; it’s a price level where selling pressure overcomes demand, preventing the price from rising further. This acts as a ceiling; when the price reaches this level, sellers tend to emerge, pushing it back down.
Why are Support and Resistance Important?
These levels are vital because they help traders and investors identify potential entry and exit points, set stop-loss orders, and gauge the overall strength of a trend.
Psychology Behind These Levels
Support and resistance levels often become self-fulfilling prophecies. Traders remember past price points where the stock reversed, influencing their future trading decisions and reinforcing these levels.
How are Support and Resistance Levels Identified?
Identifying these levels involves looking at historical price action, using various technical indicators, and understanding chart patterns.
Historical Price Action
The most straightforward method is examining past price charts. Look for price points where the stock has repeatedly bounced off or reversed from. These ‘pivotal points’ are strong indicators of support and resistance.
Trendlines
Trendlines are diagonal lines drawn on a price chart connecting a series of higher lows (for an uptrend, acting as support) or lower highs (for a downtrend, acting as resistance).
Moving Averages
Commonly used moving averages, like the 50-day and 200-day moving averages, can act as dynamic support or resistance levels, especially in trending markets.
Chart Patterns
Certain chart patterns, such as double tops/bottoms or head and shoulders, have inherent support and resistance implications built into their structure.
Volume Analysis
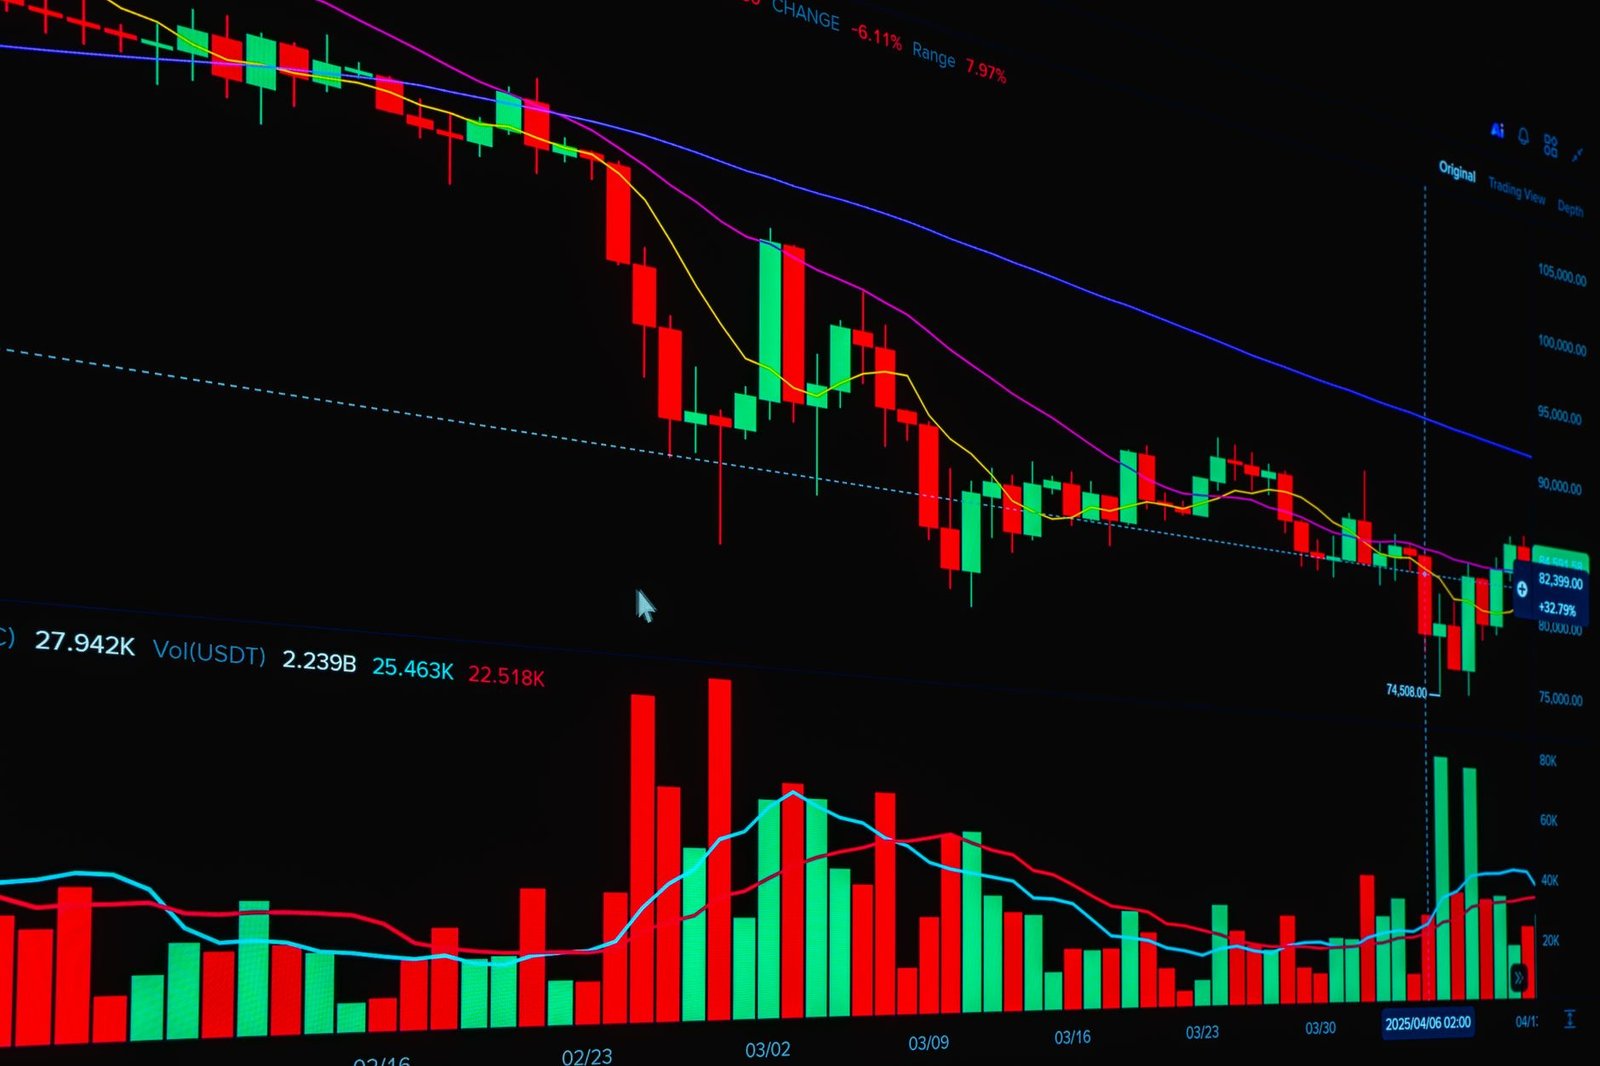
High trading volume at a particular price level can confirm the significance of that support or resistance point, indicating strong conviction from market participants.
How to Use Support and Resistance in Trading?
Using these levels effectively can significantly improve your trading strategy and risk management.
Entering Trades
Traders often look to buy near a support level, expecting a bounce, or sell/short near a resistance level, anticipating a reversal.
Setting Stop-Loss Orders
A stop-loss order is typically placed just below a support level for a long position, or just above a resistance level for a short position, to limit potential losses if the price breaks through.
Profit Targets
Resistance levels can serve as profit targets for long trades, while support levels can be profit targets for short trades.
Breakouts and Breakdowns
When a stock price decisively moves beyond a support or resistance level, it’s called a breakout (above resistance) or breakdown (below support). These can signal the start of a new trend.
Role Reversal
Once a resistance level is decisively broken, it often becomes a new support level. Conversely, a broken support level can turn into new resistance.

Common Pitfalls to Avoid
While powerful, support and resistance levels aren’t foolproof. Being aware of common mistakes can save traders from unnecessary losses.
Treating Levels as Exact Lines
Support and resistance are more like zones or areas rather than precise price points. Prices can briefly penetrate these levels before reversing.
Ignoring Volume
A breakout or breakdown without a significant increase in volume can be a false signal (a ‘fakeout’), indicating the price may soon revert.
Over-reliance on a Single Method
Using only one indicator or method to identify support/resistance can be risky. It’s better to use multiple confirmations.
Disregarding the Overall Trend
While counter-trend trading near support/resistance can be profitable, it’s generally riskier than trading in the direction of the established trend.
Not Adjusting Levels
Market conditions change. Support and resistance levels are not static and need to be re-evaluated as new price data emerges.
Is Support and Resistance Still Relevant Today?
Yes, support and resistance levels remain highly relevant and are a cornerstone of technical analysis for traders across all markets, including the NSE and BSE.
Timeless Principles
The psychological principles that underpin support and resistance – fear and greed – are timeless and continue to influence market behaviour, making these levels consistently observable.
Adaptability
While the methods of identification can evolve with technology and new indicators (like those available through a TradingView indicator on Finovatives), the core concept of price memory and psychological barriers holds true.
Confirmation with Tools
Modern trading platforms and tools, such as those offered by Finovatives, allow for easier identification and confirmation of these levels, integrating them with other analytical methods for a comprehensive strategy. Using the Trend Traders Tool, for instance, can help identify these key areas.

Frequently Asked Questions
What is the difference between support and resistance?
Support is a price floor where buying interest is expected to overcome selling pressure, potentially stopping a price decline. Resistance is a price ceiling where selling interest is expected to overcome buying pressure, potentially stopping a price advance.
Can support become resistance and vice versa?
Yes, once a significant support level is broken, it often becomes a resistance level. Similarly, a broken resistance level frequently turns into a new support level. This is known as role reversal.
How many support and resistance levels should I look for?
Focus on the most significant levels formed by multiple price touches or high volume. Typically, 1-3 key support and 1-3 key resistance levels are sufficient for making trading decisions.
Are support and resistance levels always accurate?
No, they are not always accurate. Prices can break through support or resistance due to strong market news, high volatility, or manipulation. They indicate potential turning points, not guarantees.
How can I practice identifying support and resistance?
You can practice by analysing historical charts of stocks, drawing trendlines, and observing price reactions at different levels. Many platforms offer demo accounts for risk-free practice.
How to Master Support and Resistance
- Study Historical Charts: Analyse past price movements of various stocks on different timeframes.
- Identify Key Price Points: Look for areas where the price has repeatedly reversed or paused.
- Draw Trendlines: Connect higher lows in an uptrend and lower highs in a downtrend.
- Apply Moving Averages: Observe how prices interact with common moving averages (e.g., 50-day, 200-day).
- Use Volume as Confirmation: Check for increased trading volume at potential support/resistance levels.
- Observe Breakouts/Breakdowns: Monitor price action when it approaches these levels and look for decisive moves with high volume.
- Practice on Demo Accounts: Implement your learned strategies on a virtual trading account before risking real capital.
- Review and Refine: Regularly review your trades and adjust your approach based on performance and market changes.
Key Takeaways:
- Support and resistance are price zones where trends may pause or reverse.
- Identify them using historical price action, trendlines, and moving averages.
- Use these levels to determine entry/exit points and set stop-losses.
- Be aware of common pitfalls like treating levels as exact lines or ignoring volume.
- Support and resistance are timeless concepts, still highly relevant in today’s markets.
- Breakouts and breakdowns, especially with high volume, can signal trend changes.
- Always confirm potential levels with multiple indicators and methods.
Disclaimer: Stock market investments are subject to market risks. Read all related documents carefully before investing. This guide is for educational purposes only and does not constitute financial advice.





 Finovatives