

TL;DR: The most effective intraday trading strategies for the Indian stock market involve leveraging price action, technical indicators, and strict risk management to capture short-term price movements, with scalping, breakout trading, and pivot point strategies being popular choices.
Key Stats at a Glance:
- NSE trading volume: Over 7 crore shares on average daily in FY24.
- BSE trading volume: Over 50 lakh shares on average daily in FY24.
- Nifty 50 volatility index (India VIX): A recent average of 12-15, indicating moderate market volatility.
- Average intraday profit target for scalping: 0.5% – 1% of capital per trade.
- Stop-loss adherence: Crucial for 90% of successful intraday traders to limit losses.
What is Intraday Trading?
Intraday trading, also known as day trading, involves buying and selling financial instruments within the same trading day, aiming to profit from small price fluctuations.
The fundamental principle of intraday trading is to close all positions before the market closes for the day, avoiding overnight risks. This requires traders to be highly focused, disciplined, and quick in their decision-making, often relying on technical analysis and real-time market data. The Indian stock market, with its high liquidity and volatility, offers numerous opportunities for intraday traders across segments like equities, derivatives, and commodities.
The Goal of Intraday Profit
The primary goal is to generate profits by capitalizing on short-term price movements, often through high-frequency trades with small profit targets per trade, compounded over multiple successful trades.
Risks in Intraday Trading
Intraday trading inherently carries significant risk due to leverage, rapid price changes, and the psychological pressure of short-term decision-making. Losses can be substantial and occur quickly if positions are not managed properly.
What are the Top Intraday Trading Strategies?
The most effective intraday trading strategies for the Indian stock market focus on identifying short-term trends and patterns using technical analysis tools and strict risk-reward ratios.
These strategies aim to exploit the volatility present during market hours. Popular approaches include scalping for small, frequent gains, breakout trading to catch momentum moves, and using pivot points to anticipate support and resistance levels. Each strategy requires a different approach to entry, exit, and risk management, tailored to the trader’s personality and market conditions. Understanding the nuances of each strategy is key to successful implementation in the dynamic Indian markets.
Scalping Strategy
Scalping involves making numerous trades a day to capture tiny profits from small price changes, typically aiming for a few points or paisa per trade. This strategy requires extremely fast execution and tight stop-losses.
Breakout Trading Strategy
Breakout trading focuses on identifying when a stock’s price moves beyond a defined support or resistance level, anticipating a continuation of that move. Traders enter positions once the breakout is confirmed, with stop-losses placed below the breakout level (for long trades) or above (for short trades).
Pivot Point Strategy
This strategy uses pivot points, calculated from the previous day’s high, low, and closing prices, to predict potential support and resistance levels for the current trading day. Traders often look to buy near support levels and sell near resistance levels, or trade in the direction of the price movement after it breaks a pivot level.
Momentum Trading Strategy
Momentum trading involves identifying stocks that are moving strongly in a particular direction (up or down) and entering trades in that direction, expecting the momentum to continue in the short term. Indicators like the Relative Strength Index (RSI) or Moving Averages are often used.
News-Based Trading Strategy
This approach involves trading based on the anticipated or actual impact of news events, such as economic data releases, corporate announcements, or geopolitical developments, on stock prices. It requires quick reactions and an understanding of how markets typically respond to specific news.
How Does Technical Analysis Aid Intraday Trading?
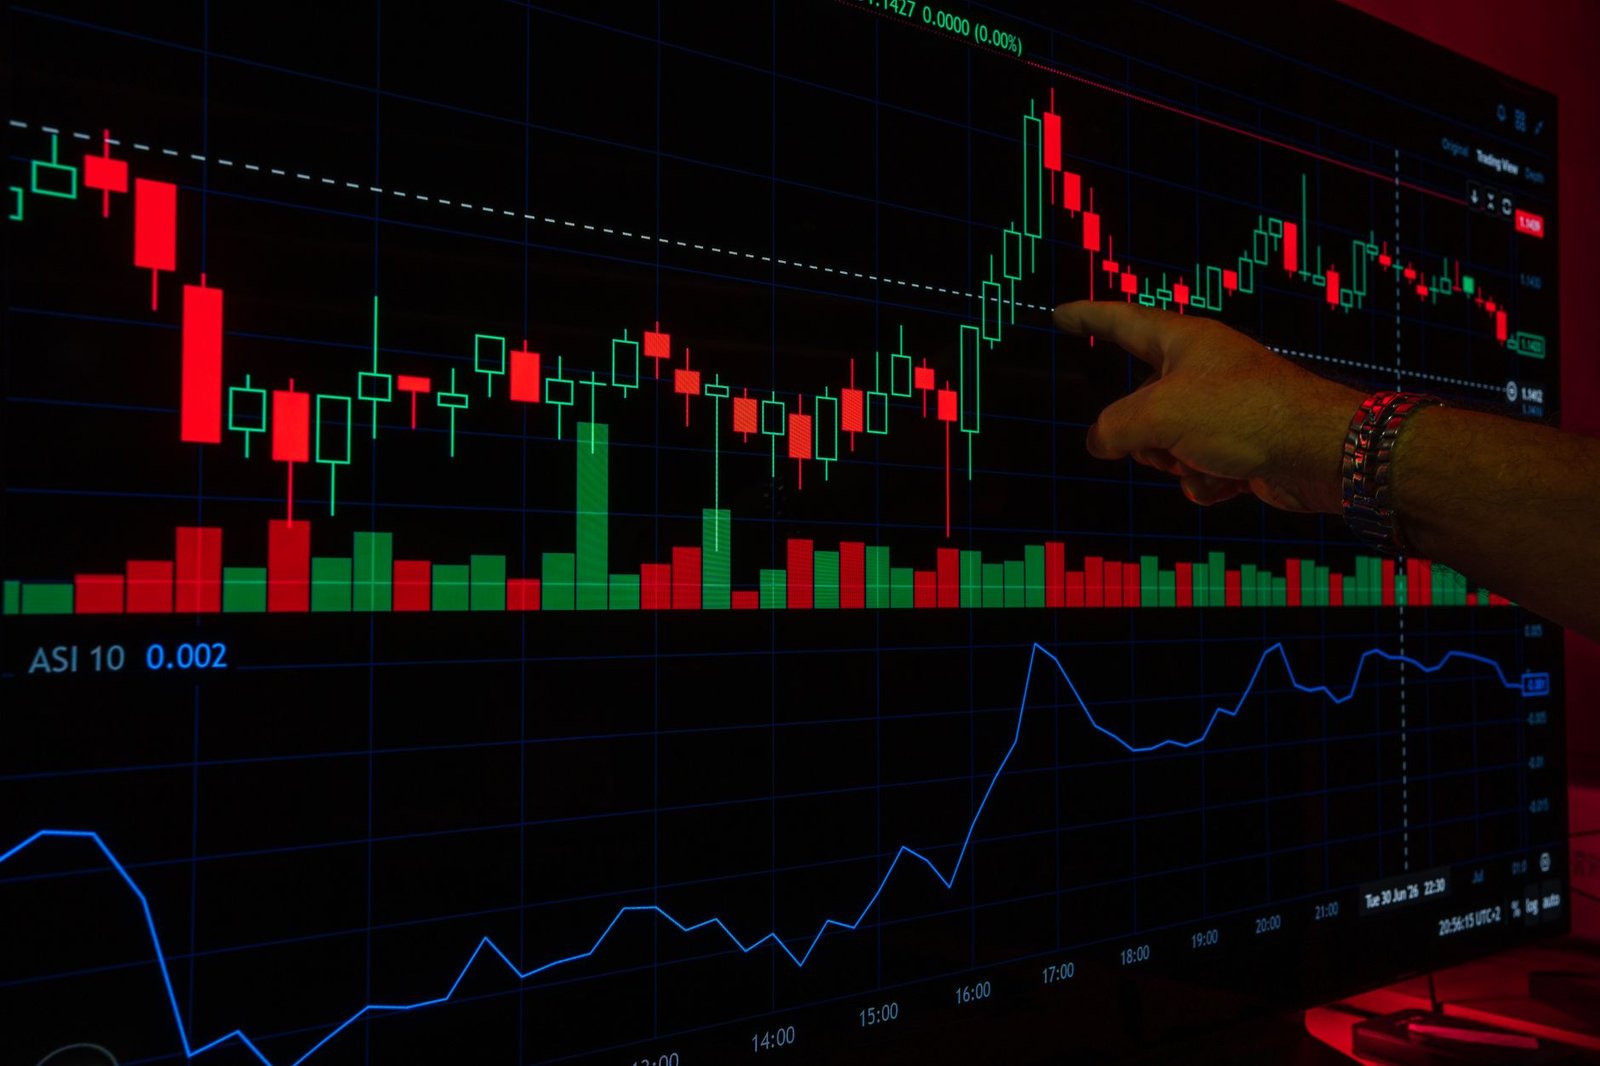
Technical analysis is the cornerstone of intraday trading, providing the tools and indicators necessary to make informed trading decisions based on historical price and volume data.
It helps intraday traders identify potential entry and exit points, gauge market sentiment, and manage risk by forecasting future price movements. By studying chart patterns, using indicators like Moving Averages, MACD, RSI, and Bollinger Bands, and analyzing volume, traders can develop a clearer picture of short-term market dynamics. This data-driven approach allows for more objective trading decisions, reducing reliance on gut feelings and increasing the probability of success.
Understanding Candlestick Patterns
Candlestick patterns, such as Doji, Hammer, Engulfing patterns, provide visual cues about market sentiment and potential reversals or continuations at specific price points.
Utilising Moving Averages
Moving averages (e.g., 5-day, 20-day) help smooth out price data to identify the trend direction and potential support/resistance levels. Crossovers between different moving averages can signal trading opportunities.
Leveraging Volume Analysis
Volume confirms the strength of a price move. High volume accompanying a price surge suggests strong buying interest, while high volume during a price drop indicates strong selling pressure.
Using Oscillators (RSI, MACD)
Oscillators like the RSI and MACD help identify overbought or oversold conditions and potential trend reversals. They are often used in conjunction with other indicators and price action.
Chart Patterns: Triangles, Flags, Pennants
Recognizable chart patterns can predict the continuation or reversal of a price trend, offering traders specific entry and exit points based on their formation and breakout.
Support and Resistance Levels
Identifying key price levels where buying pressure tends to overcome selling pressure (support) or vice versa (resistance) is crucial for setting stop-losses and profit targets.
The Importance of A TradingView Indicator
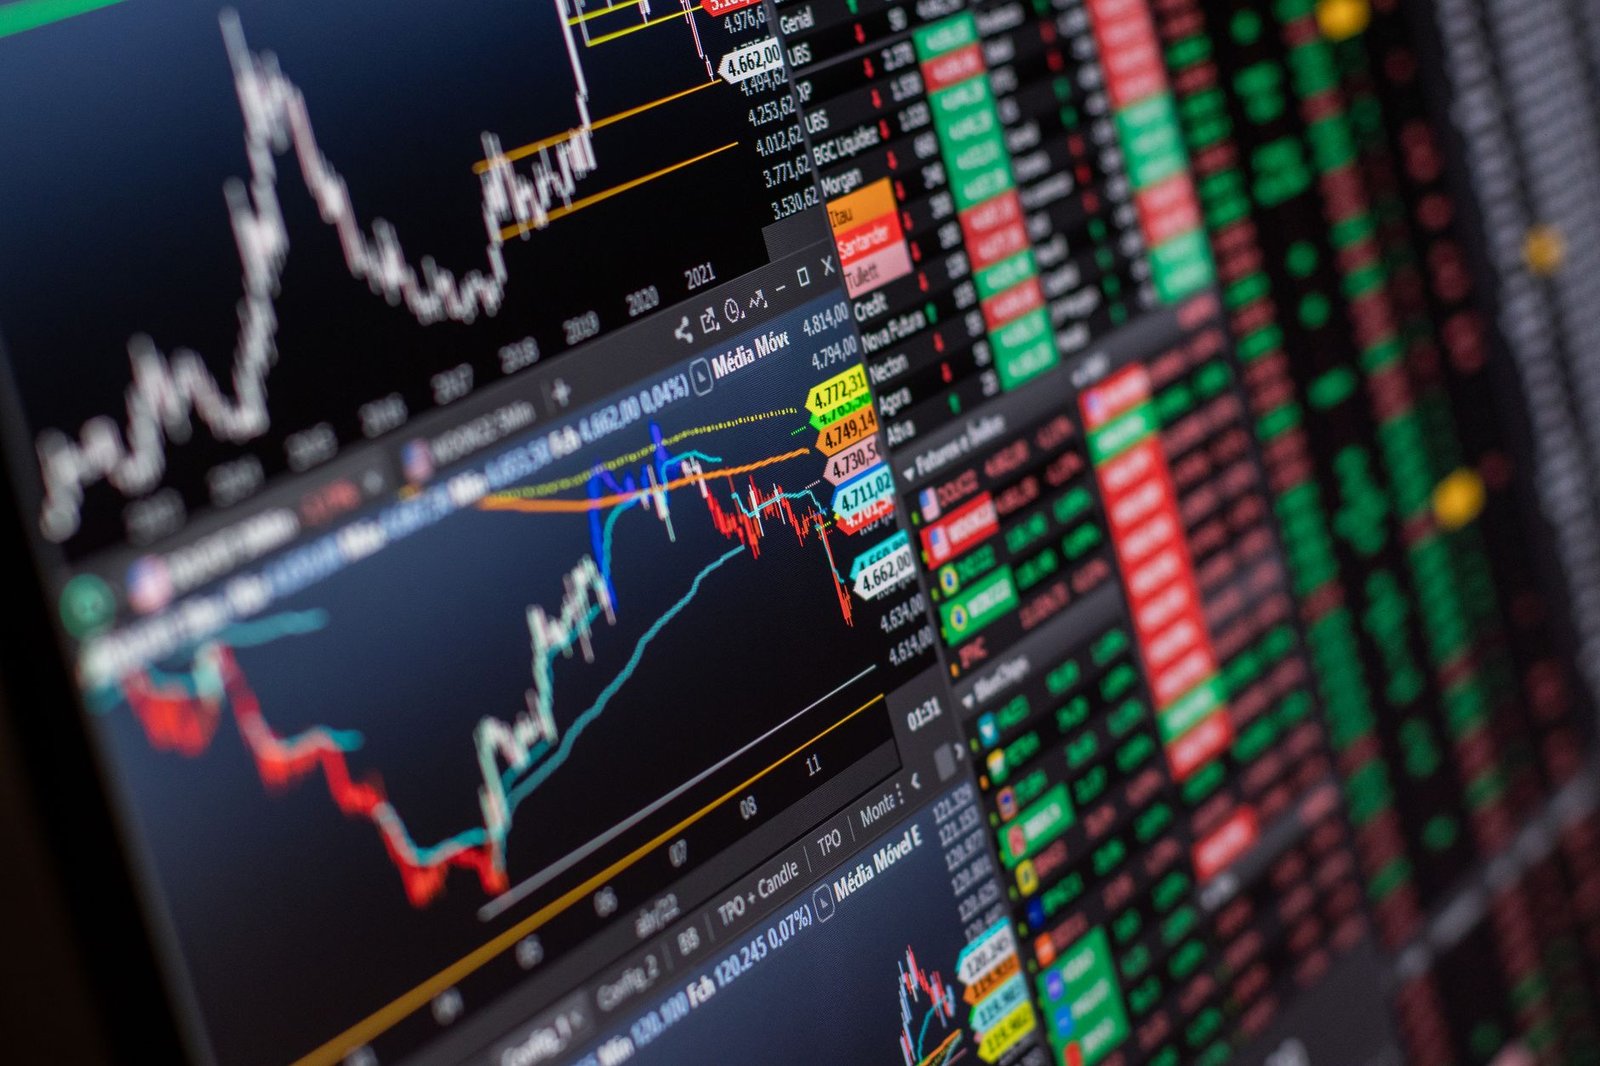
Advanced tools like a specialized TradingView indicator can help streamline the analysis process, providing real-time signals and pattern recognition that are vital for quick intraday decisions.
How to Implement an Intraday Trading Strategy Effectively
Successfully implementing an intraday trading strategy requires a systematic approach encompassing preparation, execution, and post-trade analysis, with a strong emphasis on risk management.
It’s not just about picking a strategy but about adhering to its rules consistently and adapting to market conditions. This involves defining clear entry and exit rules, setting strict stop-loss orders for every trade, and managing the position size according to your risk tolerance. Regular review and refinement of the strategy based on performance are essential for long-term success in the fast-paced Indian stock market.
- Develop a Trading Plan: Define your strategy, risk tolerance, capital allocation, and trading hours.
- Choose Your Stocks Wisely: Focus on liquid stocks with sufficient volatility and clear intraday trends, often from NSE or BSE indices.
- Master Technical Analysis: Learn to read charts, identify patterns, and use indicators effectively for signals.
- Set Strict Stop-Loss Orders: Determine your maximum acceptable loss per trade and set a stop-loss order immediately upon entry.
- Define Profit Targets: Set realistic profit targets based on your strategy and market conditions, and exit when they are met.
- Manage Position Size: Never risk more than 1-2% of your total trading capital on a single trade.
- Execute with Discipline: Stick to your plan and avoid emotional decisions driven by fear or greed.
- Review and Refine: Regularly analyze your trades to identify what worked, what didn’t, and how to improve your strategy.
What Are Essential Risk Management Techniques?
Effective risk management is paramount in intraday trading to protect capital and ensure longevity in the market, as losses are an inevitable part of trading.
Without robust risk management, even the best strategies can lead to significant financial ruin. Key techniques include setting strict stop-loss orders for every trade, diversifying across different stocks or sectors to avoid concentration risk, and never investing more than a small percentage of your capital in a single trade. Proper position sizing, based on the distance to your stop-loss and your risk tolerance, is also critical. Adherence to these principles, often guided by SEBI regulations and best practices, is what separates consistently profitable traders from those who struggle.
The Importance of Stop-Loss Orders
A stop-loss order automatically closes a trade when the price reaches a predetermined level, limiting potential losses on a single trade.
Position Sizing
Calculating the appropriate number of shares to trade based on your stop-loss distance and the percentage of capital you are willing to risk per trade.
Diversification
Spreading your trades across different stocks or sectors to reduce the impact of a single bad trade or a downturn in a specific area.
Risk-Reward Ratio
Ensuring that your potential profit from a trade is significantly higher than your potential loss (e.g., 2:1 or 3:1 ratio) before entering the trade.
Avoiding Over-Leveraging
Using leverage cautiously, as while it can magnify profits, it can also magnify losses rapidly, especially in volatile intraday markets.
Frequently Asked Questions
Is intraday trading profitable in India?
Intraday trading can be profitable in India if executed with a well-defined strategy, strict risk management, and discipline. However, it carries high risk, and many traders incur losses.
What is the best time for intraday trading in India?
The best time is typically during the first 1-2 hours after the market opens (9:15 AM – 11:00 AM IST) and the last hour before closing (2:30 PM – 3:30 PM IST) due to higher volume and volatility.
What is a good stop-loss for intraday trading?
A good stop-loss is typically 0.5% to 1% of the stock’s price or a fixed percentage of your trading capital (e.g., 1-2% of total capital per trade), depending on the strategy and stock volatility.
Which indicator is best for intraday trading?
There isn’t one ‘best’ indicator; however, Moving Averages, RSI, MACD, and Bollinger Bands are highly popular and effective when used in combination with price action and volume analysis.
How much capital is needed for intraday trading in India?
While technically possible with small amounts (e.g., ₹5,000-₹10,000), a capital of ₹50,000 or more is generally recommended to effectively manage risk and achieve meaningful profits.
What are the common mistakes intraday traders make?
Common mistakes include lack of a trading plan, poor risk management (no stop-loss), emotional trading, over-trading, revenge trading, and not doing enough research or analysis.
Key Takeaways
- Intraday trading involves buying and selling within the same day to profit from short-term price movements.
- Popular strategies include scalping, breakout trading, pivot points, and momentum trading.
- Technical analysis, using indicators and chart patterns, is crucial for identifying trading opportunities.
- Strict risk management, including stop-loss orders and position sizing, is essential for capital preservation.
- The early morning and late afternoon trading sessions often offer the most volatility and opportunities.
- Discipline, continuous learning, and strategy refinement are key to long-term success in intraday trading.
Trading involves substantial risk and is not suitable for all investors. Ensure you understand the risks involved and consider seeking independent financial advice.




 Finovatives