


TL;DR: Volume analysis helps decipher smart money activity on the NSE by examining trading volumes, revealing the conviction behind price movements and indicating potential market shifts.
Key Stats at a Glance:
- NSE recorded an average daily turnover of ₹85,000 crore+ in FY23.
- The Nifty 50 index has seen an average daily trading volume exceeding 150 million shares in recent years.
- Volume often precedes price: a significant volume surge can precede a major price move by hours or days.
- Institutional investors (FIIs & DIIs) typically trade in much larger volumes, making their activity discernible.
- A 10% increase in volume on a price move can signal stronger conviction than the same price move on normal volume.
What is Volume Analysis in Stock Trading?
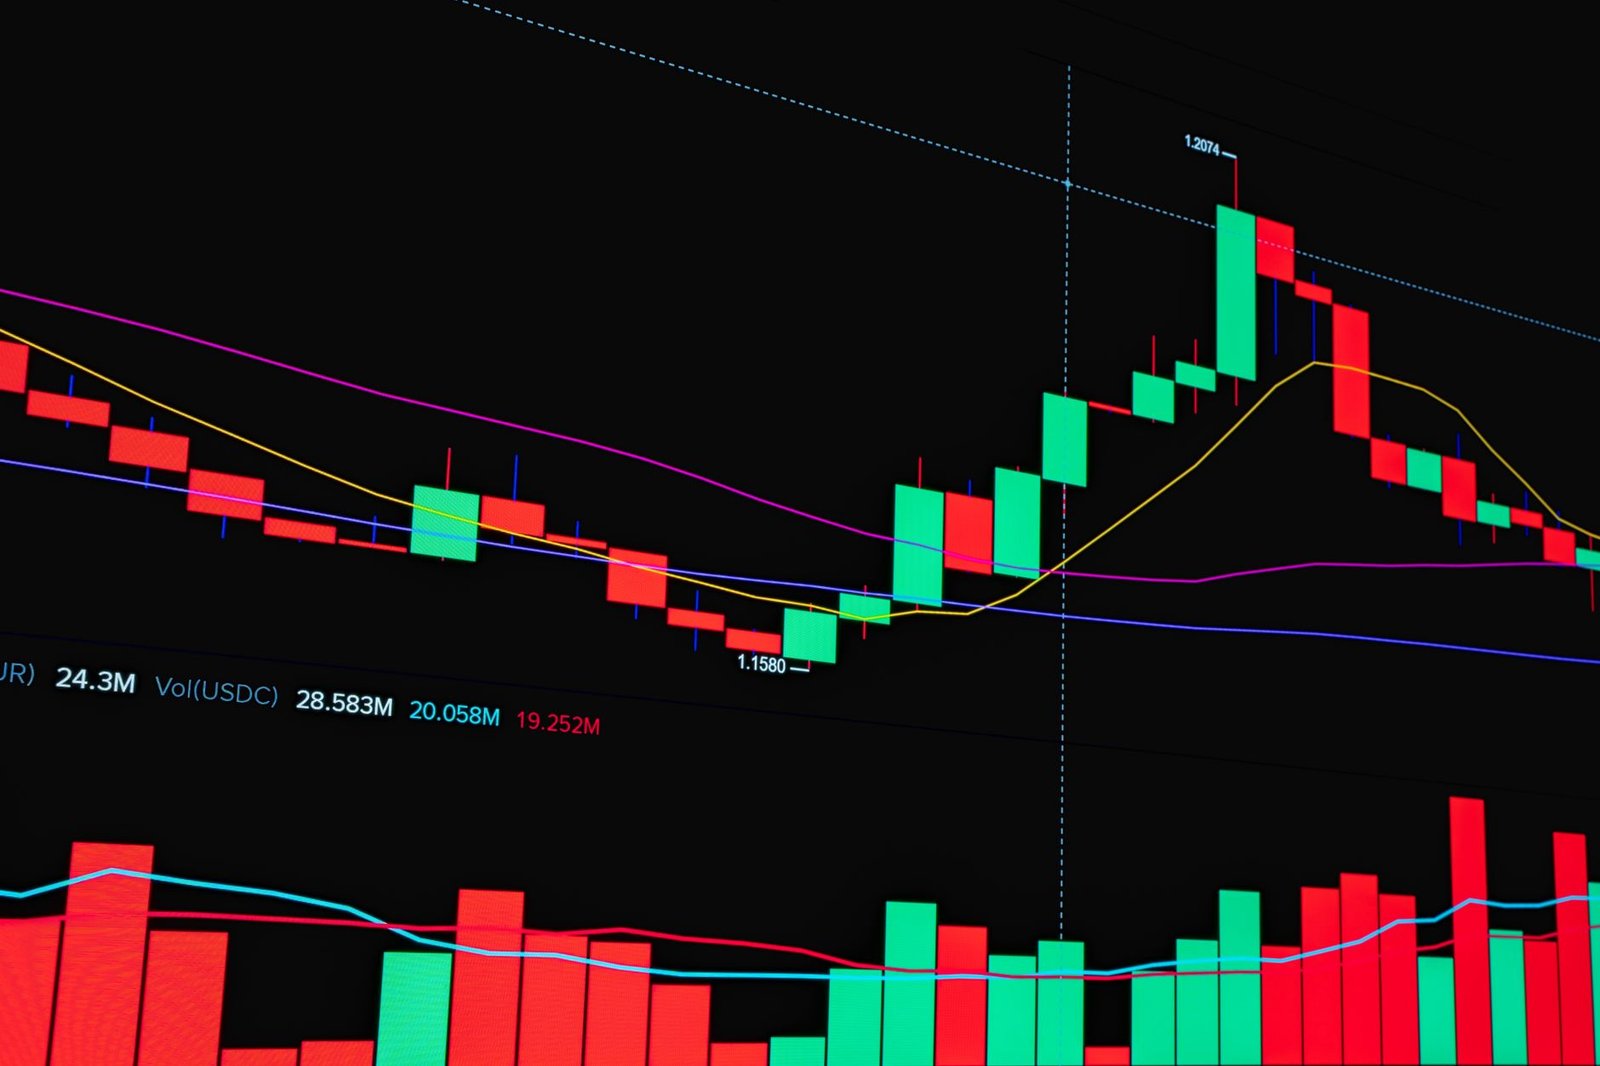
Volume analysis is a technical analysis technique that studies the number of shares or contracts traded during a specific period to gauge the strength and conviction behind price movements, helping to identify potential smart money activity.
The core principle of volume analysis is that price alone doesn’t tell the whole story. While price tells you *where* the market is going, volume tells you *how much participation* is driving that movement. High volume accompanying a price move suggests strong conviction from traders and investors, often referred to as ‘smart money’. Conversely, low volume might indicate a lack of conviction or manipulative activity, making the price move less reliable.
Understanding volume can help you confirm trends, spot potential reversals, and assess the strength of breakouts or breakdowns. It’s a fundamental tool for any serious trader looking to gain an edge in markets like the NSE.
How Does Volume Analysis Reveal Smart Money Activity?
Smart money, comprising institutional investors, large fund managers, and experienced traders, often makes significant moves that are reflected in trading volumes, allowing observant traders to infer their intentions.
These market participants have substantial capital and often accumulate or distribute positions over time. Their actions tend to create noticeable patterns in trading volume. For instance, when smart money begins to accumulate a stock, you might see increasing volume on up-days and decreasing volume on down-days, even if the price movement isn’t dramatic. This suggests buying pressure is gradually absorbing selling pressure. Conversely, a sharp increase in volume during a price decline could signal distribution by smart money, anticipating further downside.
By meticulously observing volume patterns – especially spikes, divergences, and volume during specific chart patterns – retail traders can align their trades with the perceived actions of these larger players, thereby increasing their probability of success.
What are the Key Indicators Used in Volume Analysis?
Several indicators build upon raw volume data to provide deeper insights into market dynamics and smart money sentiment.
These indicators transform volume data into more digestible and actionable signals. They help to filter out noise and highlight significant changes in trading activity. Understanding these tools is key to effectively interpreting the market’s underlying forces.
On-Balance Volume (OBV)
OBV is a momentum indicator that relates volume to price change. It suggests that volume precedes price. When the closing price is higher than the previous period’s close, the current period’s volume is added to the OBV. When the closing price is lower, the current period’s volume is subtracted from the OBV.
Volume Weighted Average Price (VWAP)
VWAP is a trading benchmark used primarily by institutional traders. It represents the average price a security has traded at throughout the day, based on both volume and price. Large orders executed at or near VWAP often indicate institutional participation.
Accumulation/Distribution Line (A/D Line)
This indicator is similar to OBV but uses the closing price relative to the high-low range of the period to determine whether volume is being accumulated or distributed. It attempts to gauge whether money is flowing into or out of a security.
Chaikin Money Flow (CMF)
Developed by Marc Chaikin, CMF measures the amount of money flow volume over a specific period. It uses both price and volume data to assess buying and selling pressure, with values typically ranging from -1 to +1.
Volume Profile
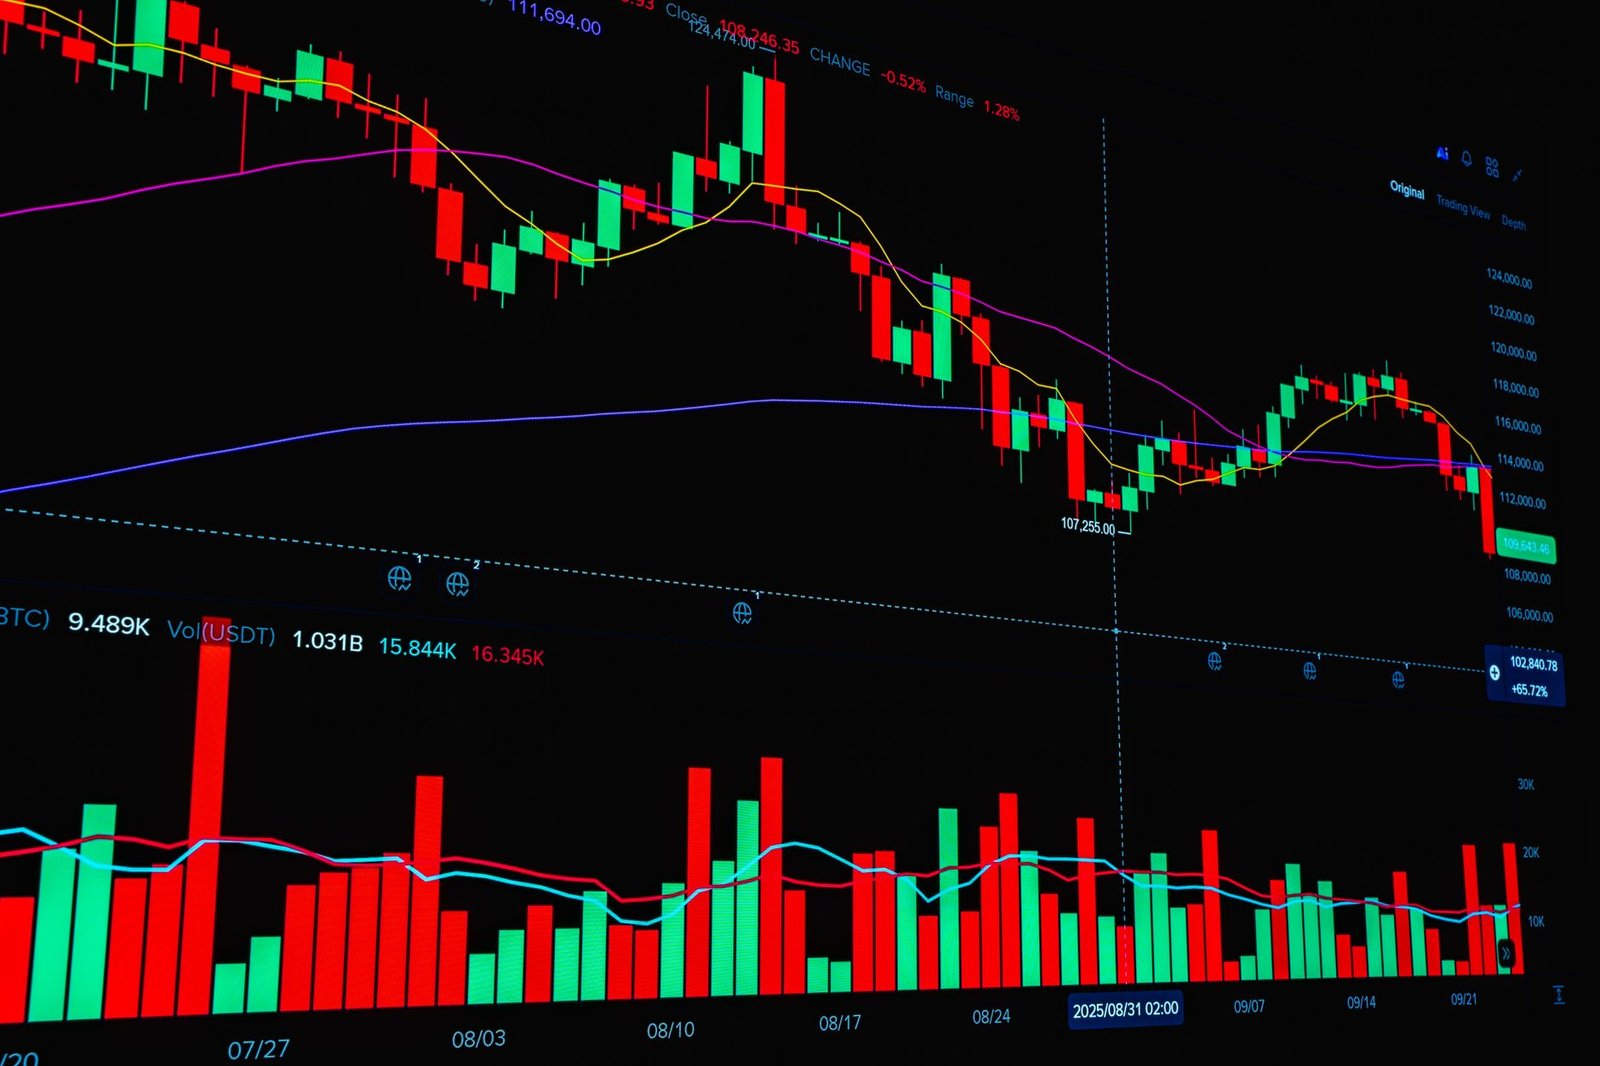
While not a traditional indicator, Volume Profile displays trading activity at specific price levels over a given period. High volume nodes (HVNs) indicate prices where significant trading occurred, often acting as support or resistance, while Low Volume Nodes (LVNs) suggest prices where little trading happened, potentially leading to faster price movement through them.
How to Incorporate Volume Analysis into Your Trading Strategy
Integrating volume analysis requires a systematic approach to confirm price action and identify high-conviction trading opportunities on the NSE.
Simply looking at volume spikes isn’t enough. You need to understand the context – what is the price doing? What is the overall market trend? By combining volume insights with price patterns and other technical tools, you can build a more robust trading strategy.
Here’s a practical guide to incorporating volume analysis:
- Confirm Trend Strength: During an uptrend, look for rising prices accompanied by increasing volume. During a downtrend, look for falling prices with increasing volume. If price moves are not supported by volume, the trend may be weakening.
- Identify Reversals: Watch for significant volume spikes at potential turning points. For example, a sharp increase in volume on a day when a stock fails to make new highs (a bearish sign) or a surge in buying volume on a day when a stock bounces strongly from support could signal a reversal.
- Validate Breakouts/Breakdowns: A breakout above resistance or a breakdown below support is considered more reliable if accompanied by a substantial increase in trading volume. Low volume breakouts are often false signals (bull/bear traps).
- Spot Divergences: Look for situations where price is making new highs or lows, but the volume indicator (like OBV or A/D Line) is not confirming this move. For instance, if the price makes a new high but OBV makes a lower high, it’s a bearish divergence suggesting weakening momentum.
- Analyze Institutional Footprints: Pay attention to unusually large volume bars during specific market hours, especially near the opening or closing. These can sometimes indicate large institutional orders. Utilize tools like the Trend Traders Tool that can help highlight such activities.
- Use Volume with Chart Patterns: Volume analysis enhances the reliability of chart patterns. For example, a bullish pattern like a ‘Cup and Handle’ should ideally see volume decrease during the handle formation and then surge on the breakout.
- Context is Key: Always consider the broader market context and the specific stock’s news or events. A high-volume move on bad news might be smart money exiting, while a high-volume move on good news could be strong accumulation.
Common Mistakes to Avoid in Volume Analysis
Many traders misunderstand or misapply volume analysis, leading to poor trading decisions. Awareness of these common pitfalls can significantly improve your application of this tool.
Volume is a powerful indicator, but it’s not infallible. Like any tool, it needs to be used correctly and in conjunction with other forms of analysis. Avoiding these mistakes ensures that you are extracting the most accurate insights from volume data.
- Ignoring Price Action: Relying solely on volume without considering the price movement it accompanies is a major error. Volume is a confirmation tool for price, not a standalone predictor.
- Misinterpreting Volume Spikes: A large volume spike doesn’t automatically mean ‘smart money’ is entering. It could be due to news, corporate actions (like stock splits or bonus issues), or even panic selling. Always analyze the context.
- Using Volume in Isolation: Volume analysis is most effective when combined with other technical indicators (like moving averages, RSI) and chart patterns.
- Not Adjusting for Market Cap/Liquidity: A 10,000-share volume spike might be significant for a small-cap stock but negligible for a large-cap stock like Reliance Industries. Always consider the stock’s average volume and market capitalization.
- Failing to Differentiate Between Types of Volume: Not all volume is ‘smart money’. You need to learn to distinguish between genuine institutional buying/selling and retail-driven volume or short-covering rallies.
- Over-reliance on Indicators: While indicators like OBV and A/D Line are helpful, they are derived from price and volume. Understanding the raw volume patterns themselves is crucial.
Frequently Asked Questions
What is the best volume indicator for NSE?
There isn’t a single ‘best’ indicator; effectiveness depends on your strategy. On-Balance Volume (OBV) and the Accumulation/Distribution Line (A/D Line) are popular choices for tracking momentum and potential smart money flow.
Can volume analysis predict future prices?
Volume analysis doesn’t predict prices with certainty but provides strong clues about the conviction behind price movements, helping traders anticipate potential future direction with higher probability.
How do I identify ‘smart money’ using volume?
Look for large, unusual volume spikes on significant price moves, accumulation patterns (increasing volume on up-days, decreasing on down-days), and divergences between price and volume indicators, often seen with institutional participation.
What is a high-volume breakout?
A high-volume breakout occurs when a stock price decisively moves past a resistance or support level accompanied by a significant surge in trading volume, indicating strong conviction from market participants.
Is volume analysis useful for options trading?
Yes, volume analysis is highly valuable in options trading. Analyzing the volume of specific call and put option contracts can reveal smart money sentiment and potential directional bias in the underlying stock.
How much volume increase is considered significant?
A significant volume increase is typically considered anything that is 1.5 to 2 times (or more) above the stock’s average daily volume for that period, especially when it accompanies a key price event.
Key Takeaways
- Volume analysis provides critical insights into market conviction and smart money activity on the NSE.
- High volume accompanying price moves suggests stronger participation and reliability.
- Indicators like OBV, VWAP, and A/D Line help interpret volume data more effectively.
- Volume analysis should be used in conjunction with price action and other technical tools.
- Confirm trends, identify reversals, and validate breakouts/breakdowns using volume.
- Avoid common mistakes such as ignoring price context or misinterpreting volume spikes.
- Consistent application and practice are key to mastering volume analysis for informed trading decisions.
Trading in the stock market involves inherent risks, and past performance is not indicative of future results. Always conduct thorough research and consider consulting with a SEBI-registered investment advisor before making any investment decisions.


 Finovatives