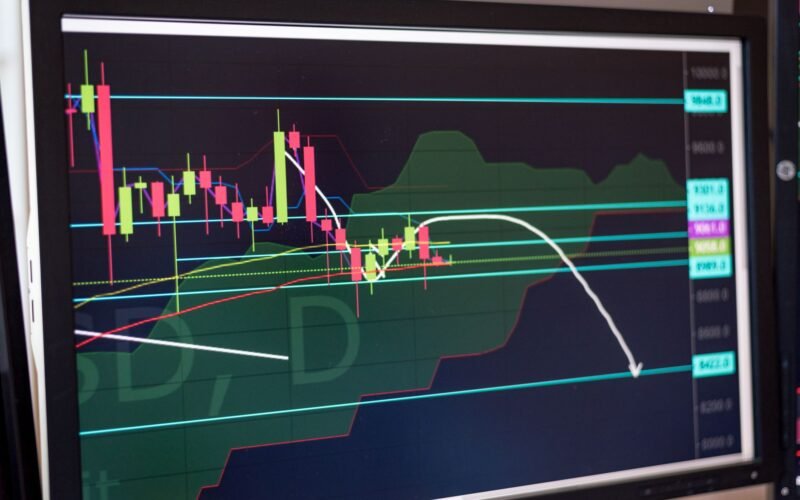


TL;DR: Market breadth indicators measure the participation of stocks in a market’s move, revealing the underlying strength or weakness beyond headline index performance, helping Indian traders make more robust decisions.
Key Stats at a Glance:
- NSE currently lists over 7,000+ securities.
- Advance-Decline Ratio often ranges between 0.5 and 2.0 for healthy markets.
- A 52-week High-Low ratio above 70% typically signals a strong uptrend.
- Volume participation in advancing stocks is often 1.5x higher than declining stocks in bull phases.
- The India VIX, a volatility index, influences trader sentiment and breadth interpretation.
What is Market Breadth?
Market breadth refers to the extent to which individual stocks in a given market or index are participating in a directional move. Instead of just looking at the price of an index like the Nifty 50 or Sensex, breadth indicators analyse the number of advancing stocks versus declining stocks, trading volumes, and new highs versus new lows.
Understanding market breadth is vital because an index can move higher due to a few heavyweights, even while a majority of stocks are falling. This divergence can signal a weakening market trend or an impending correction. Conversely, a broad-based rally, where most stocks are advancing, suggests a healthier and more sustainable uptrend.
Why is Market Breadth Analysis Crucial for Indian Traders?
Market breadth analysis is crucial for Indian traders because it provides a more granular view of market sentiment and the true strength behind price movements on exchanges like the NSE and BSE. While headline indices can be misleading, breadth indicators reveal whether the majority of stocks are contributing to the rally or decline, offering clues about sustainability and potential trend reversals.
In a diverse market like India’s, with thousands of listed securities, understanding the collective behaviour of these stocks is paramount. It helps traders identify opportunities that might be missed by solely focusing on index performance, and it aids in risk management by highlighting potential overbought or oversold conditions across the broader market.
The Advance-Decline Line: A Primary Breadth Tool
The Advance-Decline (A-D) line is perhaps the most fundamental market breadth indicator. It is calculated by taking the number of advancing stocks on an exchange or index and subtracting the number of declining stocks. This daily difference is then cumulatively added to create the A-D line. Traders observe the trend of the A-D line in conjunction with the trend of the primary index. If the index is making new highs, but the A-D line is not confirming this, it suggests a divergence and potential weakness.
New Highs vs. New Lows: Gauging Momentum
The New Highs vs. New Lows indicator measures the number of stocks that have reached a new 52-week high against those that have hit a new 52-week low. A rising number of new highs relative to new lows indicates strong bullish momentum, suggesting that many stocks are performing well and hitting fresh peaks. Conversely, a rising number of new lows can signal increasing bearish sentiment and potential downside risk. Monitoring the ratio of these new highs to new lows provides insights into the breadth of the buying or selling pressure.
Volume Analysis: The Fuel for Breadth
Trading volume is the fuel that drives market movements, and analysing it in conjunction with breadth indicators adds significant depth. Advancing Volume versus Declining Volume indicators track the total volume traded in advancing stocks versus declining stocks. A strong uptrend should ideally be accompanied by higher volume on up days and lower volume on down days. If an index is rising but the volume in advancing stocks is declining, it suggests a lack of conviction and a potential weakening trend. Similarly, heavy volume accompanying price declines can confirm selling pressure.
Volume analysis helps confirm the conviction behind price moves. For instance, if Nifty 50 is surging but the total volume in advancing stocks is lower than in declining stocks, it’s a bearish divergence.
How to Use Market Breadth Indicators for Trading Decisions
Effectively integrating market breadth indicators into your trading strategy can significantly enhance decision-making for Indian stock market participants. These tools move beyond simple price observation, offering a deeper understanding of market dynamics. By confirming trends, identifying divergences, and signalling potential reversals, breadth indicators can help you time entries and exits more effectively.
For traders who rely on sophisticated tools, integrating these breadth insights with custom TradingView indicators can offer a powerful combination. Many advanced platforms, including those providing specialised TradingView indicators, allow for the customisation and overlay of various breadth metrics directly onto price charts, simplifying analysis.
How to Interpret Market Breadth for Trading
- Confirm Trend Strength: If the Nifty 50 is making new highs and the Advance-Decline line is also making new highs, it confirms the strength of the uptrend.
- Identify Divergences: Watch for discrepancies. If the index is rising but the A-D line is falling, it’s a bearish divergence suggesting the rally may not be sustainable.
- Assess Momentum with New Highs/Lows: A high ratio of 52-week highs to lows indicates strong buying interest and bullish momentum. A low ratio suggests the opposite.
- Validate with Volume: Ensure that price moves are supported by corresponding volume trends. Strong uptrends should see higher volume on up days.
- Monitor Overbought/Oversold Conditions: Extreme readings on breadth indicators (e.g., a very high percentage of stocks above their 200-day Moving Average) can suggest the market is overbought and due for a pullback.
- Use in Conjunction with Other Tools: Breadth indicators are most powerful when used alongside price action, support/resistance levels, and other technical indicators. They should not be used in isolation.
- Consider Sectoral Breadth: Analyse breadth within specific sectors to identify areas of strength or weakness before looking at individual stocks.
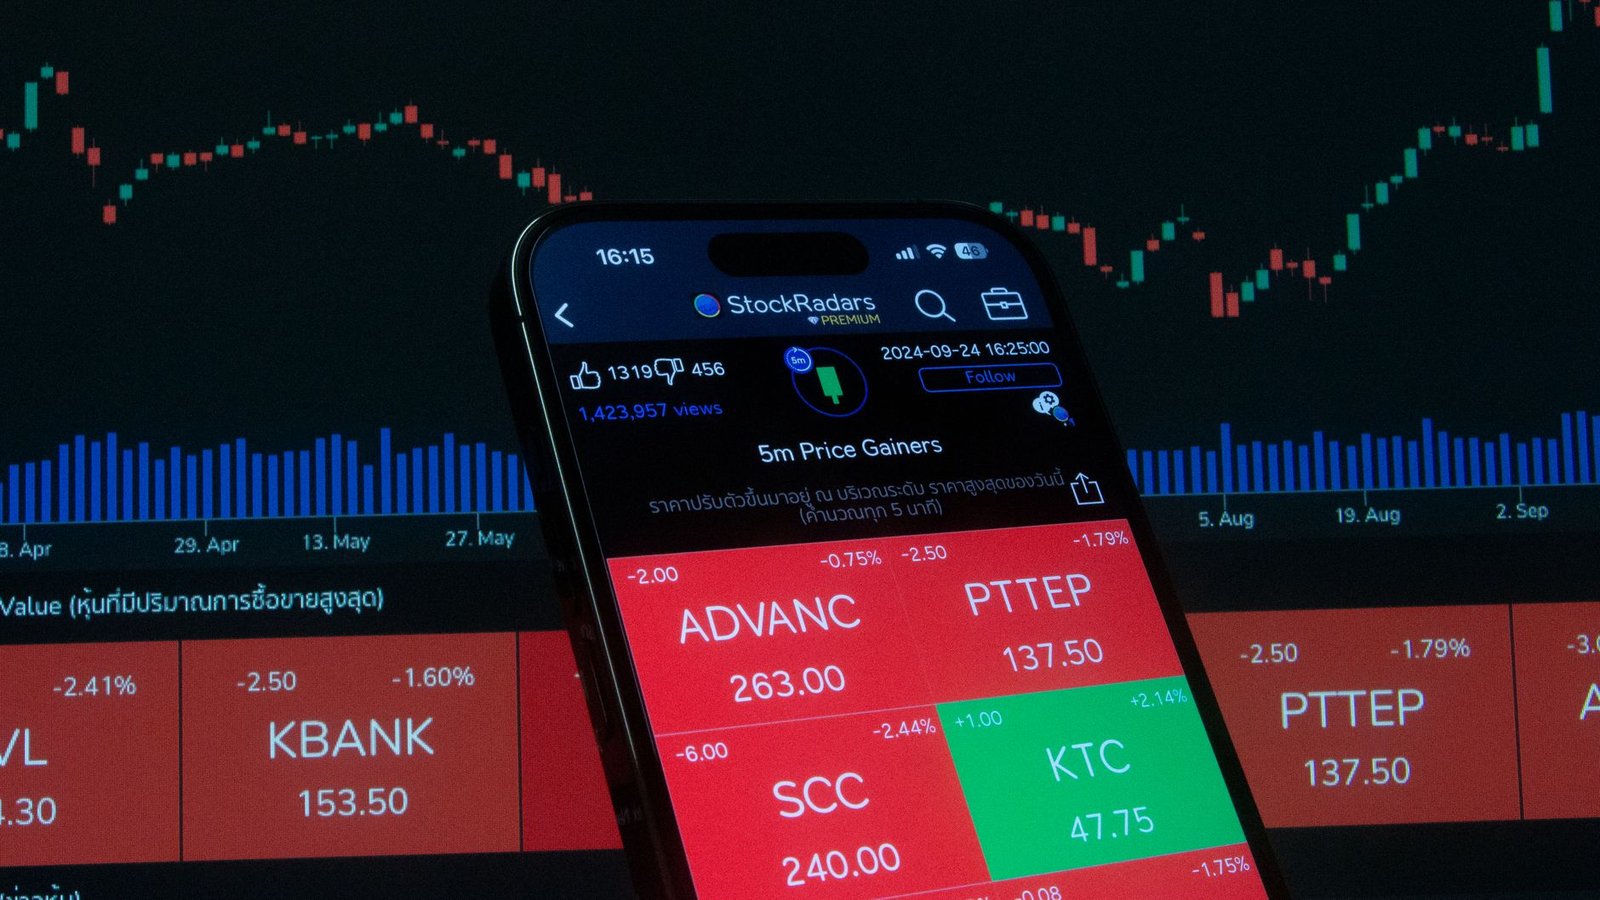
The ‘Trend Traders Tool’, a popular indicator among sophisticated traders, often incorporates breadth analysis alongside momentum and trend metrics.
Key Breadth Indicators to Watch
Beyond the A-D line and New Highs/Lows, several other breadth indicators offer valuable insights. The Percentage of Stocks Above Moving Averages (e.g., 50-day or 200-day MA) is a widely followed metric. When a high percentage of stocks are trading above their respective MAs, it signifies broad market strength. Conversely, a low percentage indicates widespread weakness. Another useful indicator is the McClellan Oscillator, a sophisticated measure derived from advances and declines, which helps pinpoint overbought and oversold conditions.
The McClellan Oscillator Explained
Developed by Sherman and Marian McClellan, this oscillator is a popular tool for gauging market sentiment and potential turning points. It is derived from the daily difference between advancing and declining stocks, smoothed using exponential moving averages. Its value fluctuates around zero, with positive readings suggesting bullish momentum and negative readings indicating bearish momentum. Extreme readings above +100 or below -100 are often considered significant, signalling potential overbought or oversold conditions respectively.
Sectoral Breadth Analysis
Analysing breadth on a sectoral level can provide even more targeted insights. For example, if the broader market index like the Nifty Bank is advancing, but the breadth within the banking sector itself is deteriorating (fewer banks advancing than declining), it suggests the index move might be concentrated in a few large banks, and the sector’s overall health might be weaker than the index suggests. This granular approach helps identify sectors with genuine underlying strength.
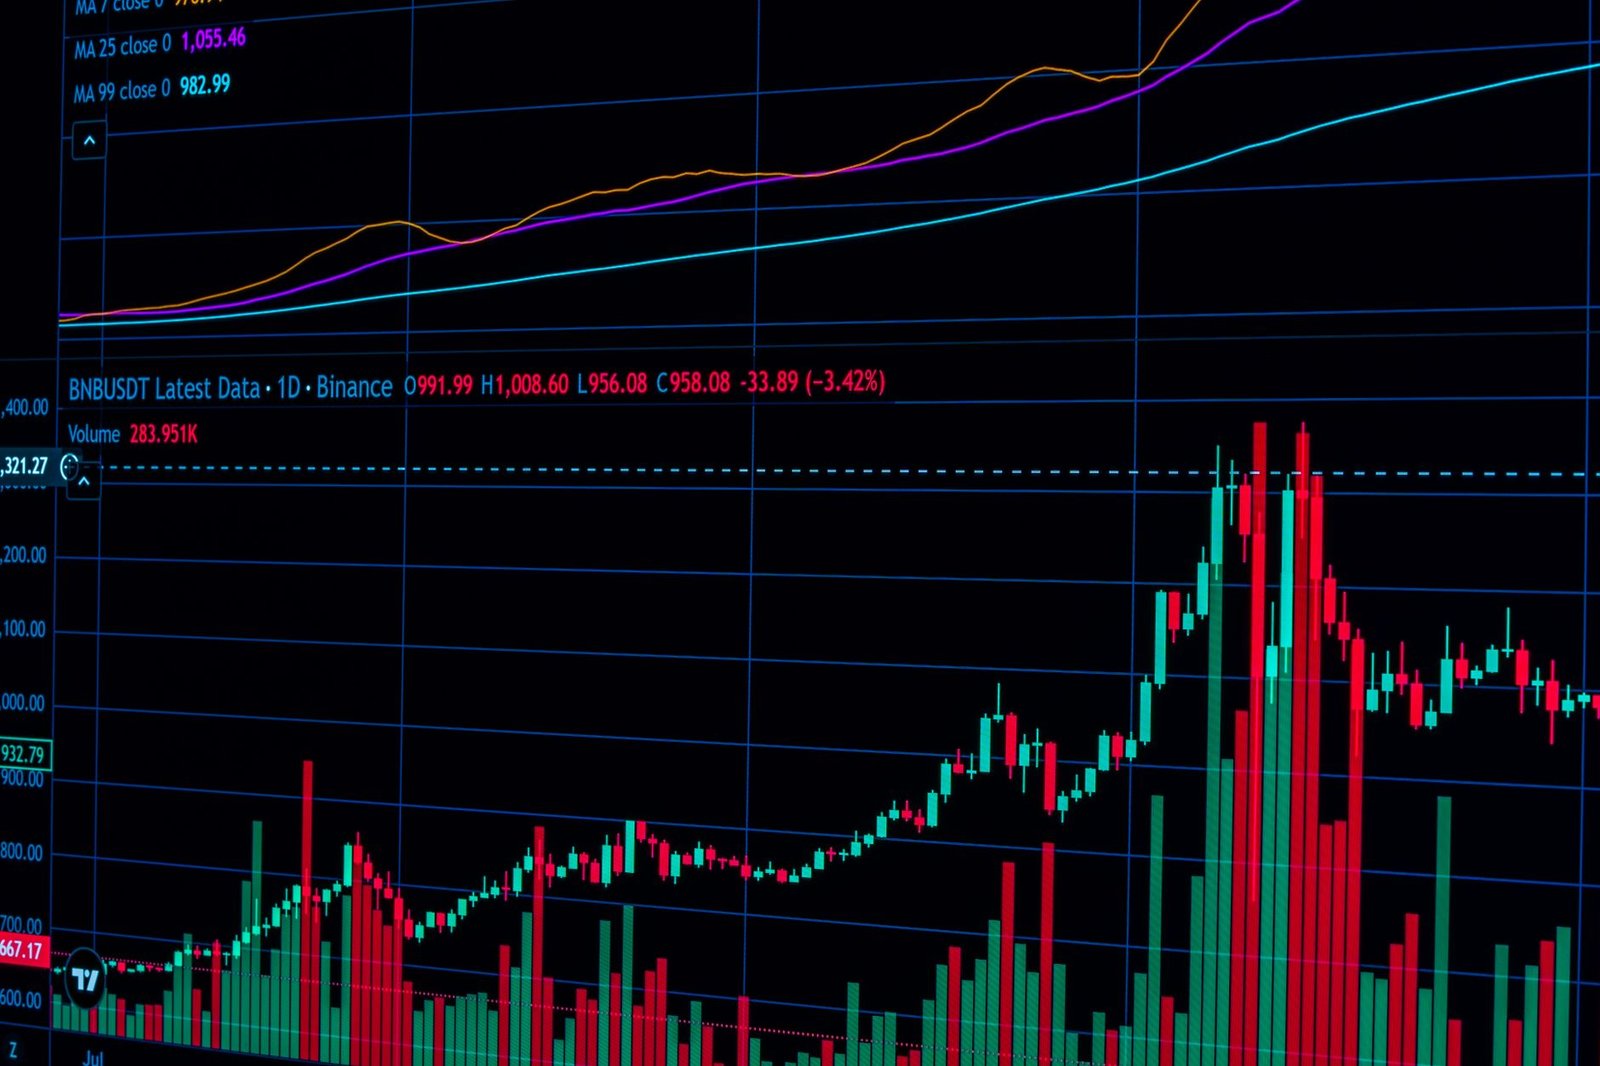
Analysing breadth within specific sectors, like IT or Pharma, can reveal hidden strength or weakness before it impacts the broader index.
Common Pitfalls in Reading Market Breadth
While market breadth indicators are powerful, traders often fall into common traps that can lead to misinterpretations and poor trading decisions. One of the most frequent mistakes is using breadth indicators in isolation. Breadth should complement, not replace, price action analysis. Relying solely on the A-D line without considering price trends can lead to false signals.
Another pitfall is overreacting to short-term fluctuations. Market breadth can be noisy; daily variations might not always signify a trend change. It’s crucial to look at longer-term trends and smoothing techniques. Furthermore, failing to adapt interpretations to different market conditions (e.g., trending vs. range-bound markets) can also lead to errors. Understanding the context provided by SEBI regulations and overall economic sentiment is also vital for a holistic view.
Ignoring Divergences
A classic mistake is ignoring significant divergences between price and breadth. When an index makes a new high, but the A-D line fails to do so, it’s a strong warning sign. Many traders might dismiss this, expecting the breadth to eventually catch up, only to be caught in a reversal. Recognizing and respecting these divergences is key to avoiding major losses.
Over-reliance on Single Indicators
No single indicator is perfect. Relying exclusively on the McClellan Oscillator or the New Highs/Lows ratio without cross-referencing with other breadth measures or price action can lead to flawed conclusions. A robust strategy involves synthesising information from multiple indicators to build a stronger conviction.
Misinterpreting Volume Confirmation
While high volume can confirm a move, its absence or contradictory nature can also be a signal. For example, if a stock or index is rallying on declining volume, it suggests a lack of conviction from buyers, making the rally suspect. Traders must understand that volume is not just about ‘more is better’ but about ‘appropriate volume for the move’.
Frequently Asked Questions
What is the most important market breadth indicator?
The Advance-Decline line is often considered the most fundamental breadth indicator. It directly measures the participation of advancing versus declining stocks, providing a clear picture of the underlying market sentiment.
Can market breadth predict market tops and bottoms?
Market breadth indicators can provide early warnings of potential tops and bottoms through divergences, but they are not perfect predictors. They signal increasing probability rather than certainty.
How often should I check market breadth?
For active traders, checking daily breadth data is recommended. For positional traders or long-term investors, weekly or monthly analysis can suffice to gauge broader trends.
When does market breadth become significant?
Breadth becomes significant when it diverges from price action, indicating a potential trend change. Consistent confirmation between price and breadth suggests a healthy trend.
Is market breadth useful for small-cap stocks?
Yes, market breadth analysis is particularly useful for smaller stocks, as their moves can be more volatile and less influenced by a few large players, offering clearer signals of underlying sentiment.
How do Indian exchanges (NSE/BSE) report breadth data?
Both NSE and BSE provide daily data on advancing/declining stocks, traded volumes, and new highs/lows, often accessible through financial news portals, brokerage platforms, and data providers.
Key Takeaways:
- Market breadth indicators measure participation of stocks, offering a deeper market view than index prices alone.
- The Advance-Decline line, New Highs/Lows, and volume analysis are core breadth tools.
- Divergences between price and breadth are critical signals of potential trend reversals.
- Breadth analysis should complement, not replace, price action and other technical tools.
- Understanding sectoral breadth provides granular insights into specific industry performance.
- Common pitfalls include using indicators in isolation or overreacting to short-term noise.
- Market breadth is a vital component for informed trading decisions in the Indian stock market.
Disclaimer: Investing in the stock market involves inherent risks. Please consult with a qualified financial advisor before making any investment decisions.




 Finovatives