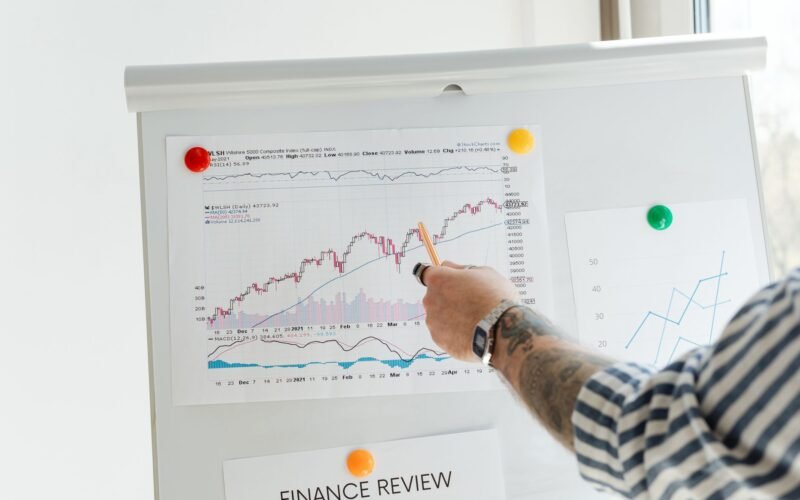



TL;DR: Understanding market cycles in the Indian stock market (BSE & NSE) involves recognizing predictable patterns of expansion and contraction, allowing traders to align their strategies with prevailing trends for potentially higher returns.
Key Stats at a Glance:
- Nifty 50 has historically shown a CAGR of ~12% over the past decade.
- BSE Sensex has delivered ~13% CAGR over the last 10 years.
- Indian equity markets have experienced major cycles of 3-5 years in length.
- Over 7,000 companies are listed across BSE and NSE combined.
- Volatility Index (India VIX) can surge by 50%+ during sharp market downturns.
What are Market Cycles in Indian Stock Markets?
Market cycles in the Indian stock exchanges like the BSE and NSE refer to the recurring, albeit not perfectly timed, periods of expansion (bull markets) and contraction (bear markets) that influence asset prices.

The Four Phases of a Market Cycle
Every market cycle generally comprises four distinct phases: Accumulation, Markup (Expansion), Distribution, and Markdown (Contraction). Understanding these phases helps traders anticipate shifts in market sentiment and price action.
1. Accumulation Phase
This is typically a quiet period following a bear market’s bottom. Smart money, or institutional investors, begin to accumulate stocks at relatively low prices, sensing a potential reversal. Retail investors might still be exiting, unaware of the impending uptrend.
2. Markup Phase (Bull Market)
As more buying pressure enters the market, prices start to rise steadily. This is the expansion or bull market phase. Positive news becomes more prevalent, and investor confidence grows. This phase attracts a wider range of investors, driving prices higher.
3. Distribution Phase
As the bull market matures and prices reach significant highs, institutional investors who bought during the accumulation phase start to distribute their holdings. They take profits, anticipating a potential downturn. Sentiment is still euphoric, but underlying selling pressure increases.
4. Markdown Phase (Bear Market)
The distribution leads to selling pressure overwhelming buying interest, causing prices to fall sharply. This is the contraction or bear market phase. Negative news dominates, and investor fear drives further selling, creating a downward spiral until a new bottom is formed, and the cycle begins again.
How Do Market Cycles Affect BSE and NSE Trading?
Market cycles significantly influence trading strategies on the BSE and NSE by dictating the overall trend and volatility, thereby affecting entry and exit points, risk management, and the types of stocks that perform best.
Impact on Trading Strategies
During bull markets (Markup phase), momentum and growth strategies tend to perform well. Investors often buy stocks with strong upward trends. Conversely, in bear markets (Markdown phase), defensive strategies, short-selling, or value investing in fundamentally strong companies might be preferred. Understanding the current cycle helps traders choose the right approach. Our proprietary Trend Traders Tool can be particularly insightful during these shifts.
Identifying Entry and Exit Points
Cycles help in identifying potential tops and bottoms. Buying during the Accumulation phase and selling during the Distribution phase, or vice-versa for short-selling, can be highly profitable. However, predicting the exact timing is challenging, making tools and indicators essential.
Risk Management Considerations
The risk profile changes drastically across cycles. Volatility typically increases significantly during the Markdown phase, as indicated by spikes in the India VIX. Proper stop-loss orders and position sizing become paramount during uncertain or downward trending markets.

Sectoral Rotation within Cycles
Different sectors tend to perform better during specific phases of the market cycle. For instance, technology and consumer discretionary stocks often lead in bull markets, while utilities and consumer staples might show resilience in bear markets. Observing these sectoral rotations provides clues about the market’s underlying health and potential future direction.
How to Identify Market Cycles on BSE and NSE
Identifying market cycles involves a combination of technical analysis, fundamental analysis, and monitoring macroeconomic indicators, looking for patterns and shifts in investor sentiment.
- Analyze Long-Term Charts: Examine weekly or monthly charts of major indices like the Nifty 50 and BSE Sensex to identify broad uptrends, downtrends, and consolidation periods. Look for recurring patterns of peaks and troughs.
- Monitor Economic Indicators: Keep track of key economic data releases from the Reserve Bank of India (RBI) and the government, such as GDP growth, inflation rates, interest rate decisions, and industrial production. These often influence the direction and duration of cycles.
- Observe Investor Sentiment: Gauge market sentiment through indicators like the India VIX (volatility index), Put-Call Ratio (PCR), and news flow. Extreme optimism often signals a market top, while extreme pessimism can indicate a bottom.
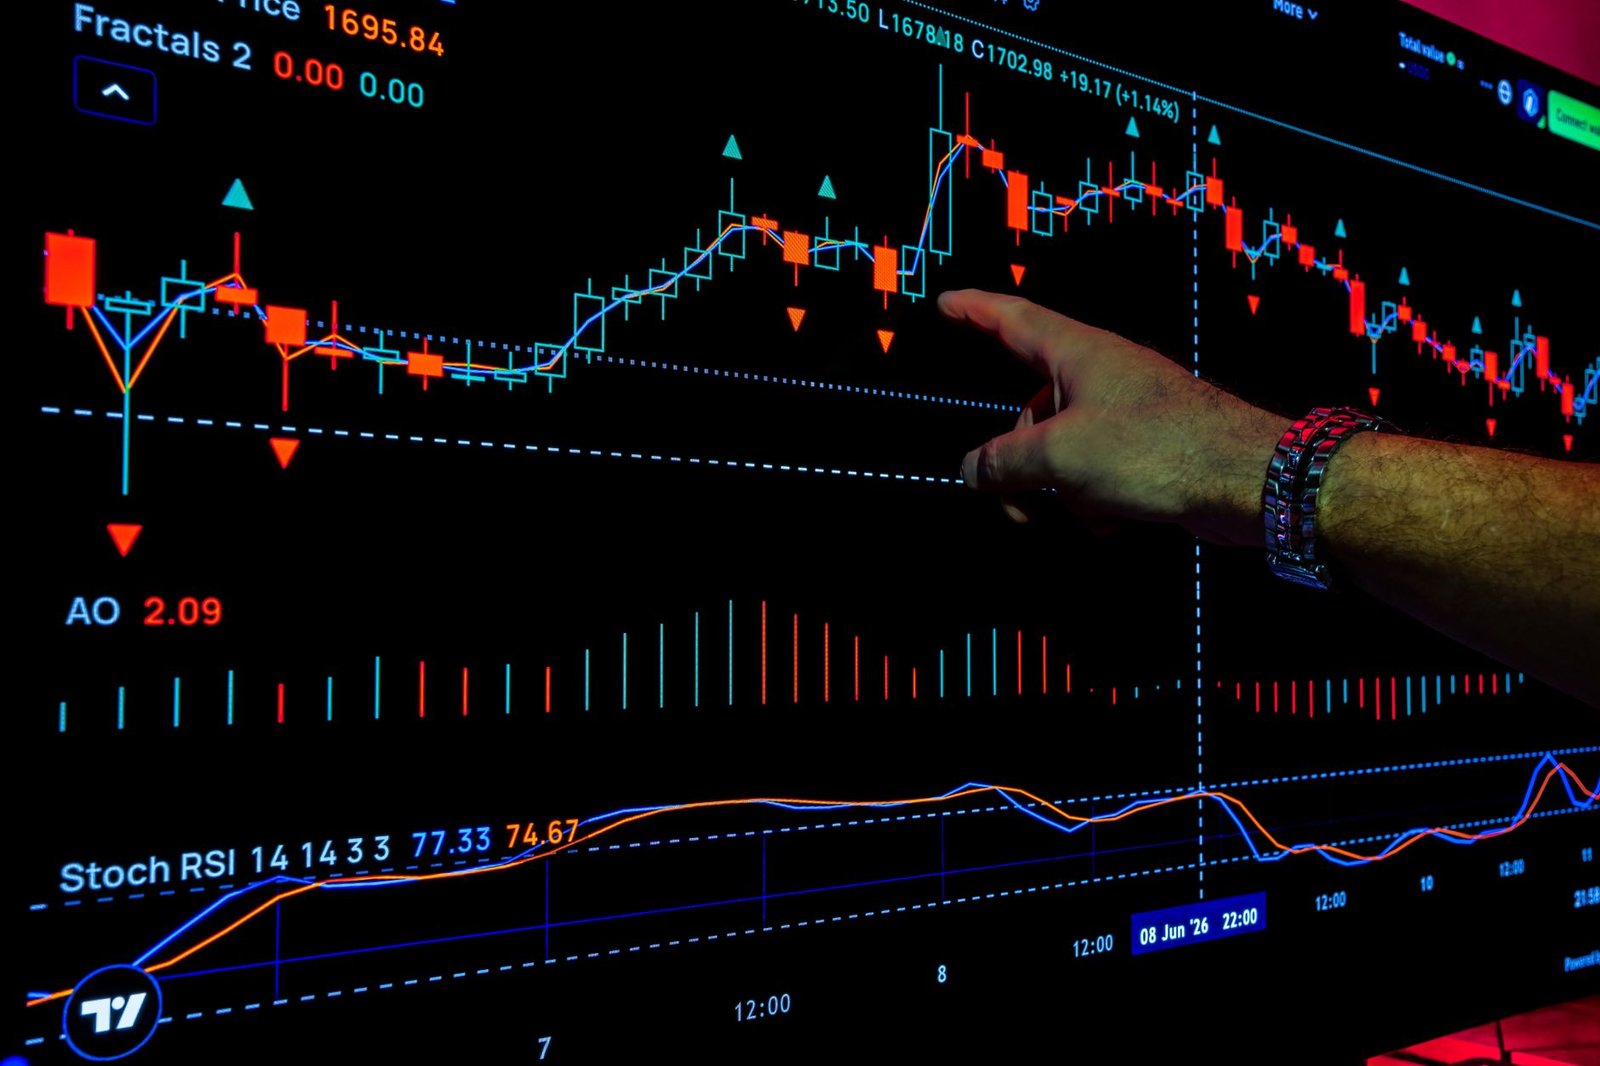
- Study Technical Indicators: Utilize tools like Moving Averages (e.g., 200-day MA), Relative Strength Index (RSI), and MACD on indices and leading stocks to identify trend strength, potential reversals, and momentum shifts. Our advanced TradingView indicator can offer visual cues.
- Track Corporate Earnings: Analyze the trend of corporate earnings growth. Strong and consistent earnings growth usually supports bull markets, while declining earnings can signal an impending bear market or confirm a downtrend.
- Learn from Historical Data: Backtest your understanding of cycles using historical data from the NSE and BSE to see how indices and sectors behaved during previous market phases.
The Role of Technical and Fundamental Analysis
Technical analysis focuses on price action and volume to identify trends and patterns associated with different cycle phases. Fundamental analysis, on the other hand, looks at the underlying economic and corporate health, which tends to deteriorate in bear markets and improve in bull markets. Both are crucial for a comprehensive view.
Understanding Sentiment Indicators
Sentiment indicators provide a gauge of the prevailing mood among market participants. High bullishness can suggest a market top is near, as most participants have already entered the market. Conversely, extreme bearishness often occurs at market bottoms, as fear drives out the last remaining sellers.
Frequently Asked Questions
What is the typical duration of a market cycle?
Market cycles don’t have fixed durations; they can range from a few months to several years. Historically, significant cycles on Indian exchanges have often lasted between 3 to 7 years, but this can vary based on economic conditions and global events.
How can I profit from market cycles?
Profit can be made by aligning your investment strategy with the prevailing market cycle. Buy during accumulation/markup phases (bull markets) and sell or reduce exposure during distribution/markdown phases (bear markets). Identifying reversals is key.
Is it possible to predict the exact timing of cycle turns?
Predicting the exact timing of market cycle turns is extremely difficult, even for seasoned professionals. Focus on identifying the phase you are likely in and adapting your strategy accordingly, rather than trying to time the market perfectly.
Which Indian sectors perform best in bull markets?
During bull markets, growth-oriented sectors like Technology, Pharmaceuticals, Consumer Discretionary, and Banking often tend to outperform as investor confidence and spending increase.
How does the India VIX relate to market cycles?
The India VIX, or volatility index, typically trends lower during bull markets (Markup phase) and spikes higher during sharp downturns and bear markets (Markdown phase), reflecting increased uncertainty and fear.
Can I use a free trial to test cycle-based strategies?
Yes, many platforms offer a free trial where you can test various trading strategies, including those based on market cycle analysis, using historical data or paper trading before committing real capital.
Key Takeaways
- Market cycles consist of four phases: Accumulation, Markup, Distribution, and Markdown.
- Understanding these cycles helps in timing entries and exits more effectively on BSE and NSE.
- Technical and fundamental analysis, along with sentiment indicators, are vital for identifying the current market phase.
- Volatility, as measured by India VIX, tends to be higher during bear markets.
- Different sectors perform better in different phases of the market cycle, indicating potential rotation.
- While exact timing is difficult, adapting strategies to the prevailing cycle can enhance trading outcomes.
- Continuous learning and backtesting are crucial for refining cycle-based trading approaches.
Trading in the stock market involves inherent risks, and past performance is not indicative of future results. Consult with a registered financial advisor before making any investment decisions.





 Finovatives