TL;DR: A breakout trading strategy for Nifty and Bank Nifty capitalises on price movements that decisively breach established support or resistance levels, aiming to capture subsequent momentum for profitable trades.
Key Stats at a Glance:
- Nifty 50’s average daily trading volume: ₹12,000 Crore+
- Bank Nifty’s average daily trading volume: ₹8,000 Crore+
- Average true range (ATR) for Nifty: ~70-100 points
- Average true range (ATR) for Bank Nifty: ~200-300 points
- SEBI mandates margin requirements for leveraged trading.
What is a Breakout in Trading?
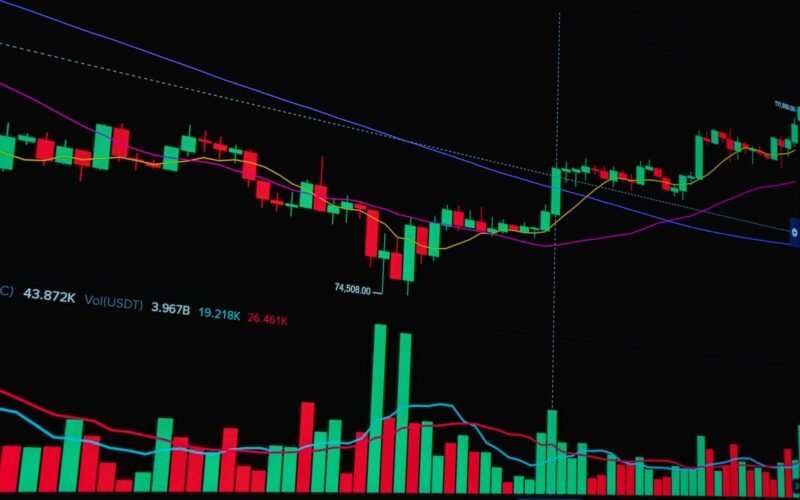
A breakout in trading occurs when the price of an asset moves significantly beyond a predetermined price level, such as a resistance level, support level, or a trendline, with increased volume. This indicates a potential shift in market sentiment and the start of a new price trend.
How to Identify Breakout Opportunities in Nifty and Bank Nifty?
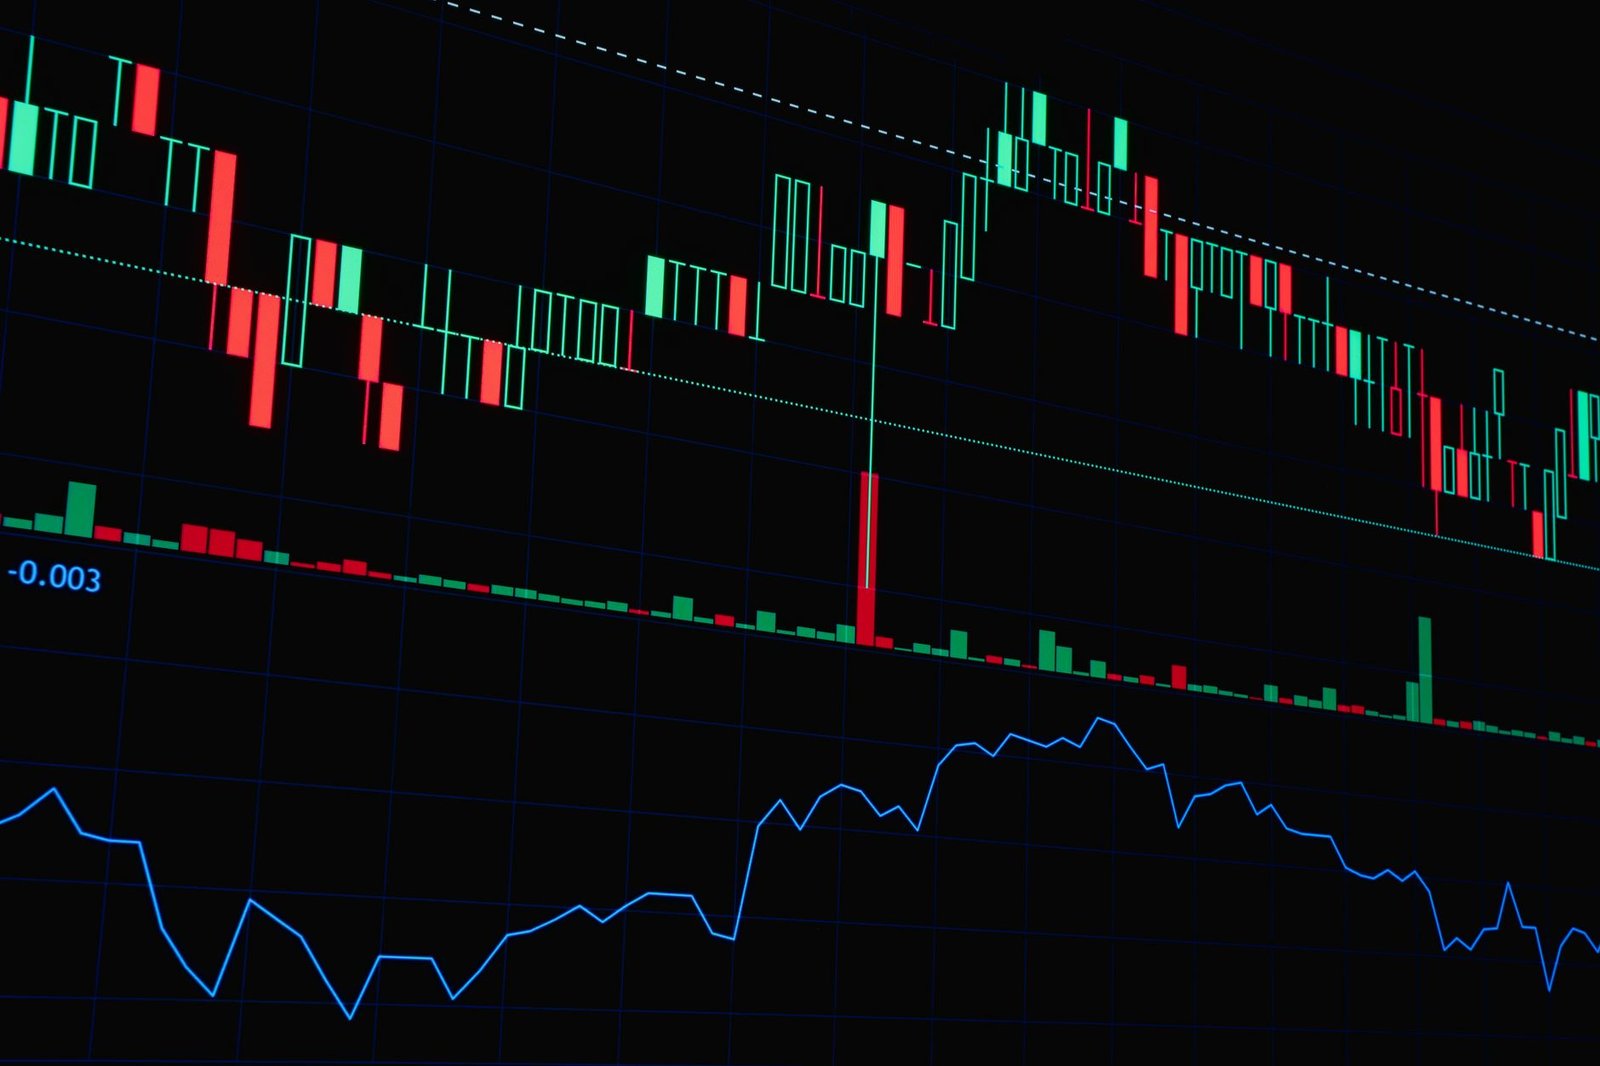
Identifying breakout opportunities requires keen observation of price action and volume patterns on the charts of Nifty and Bank Nifty. Look for periods of consolidation where the price moves within a defined range, forming clear support and resistance levels, often visualised as chart patterns like triangles, rectangles, or flags, anticipating a decisive move out of this range.
Recognising Consolidation Patterns
Consolidation refers to a period where the price of Nifty or Bank Nifty trades sideways, typically after a significant move. Traders look for patterns like symmetrical triangles, ascending triangles, descending triangles, and rectangular channels. These patterns indicate a temporary pause in the prevailing trend, building energy for the next directional move.
The Role of Volume
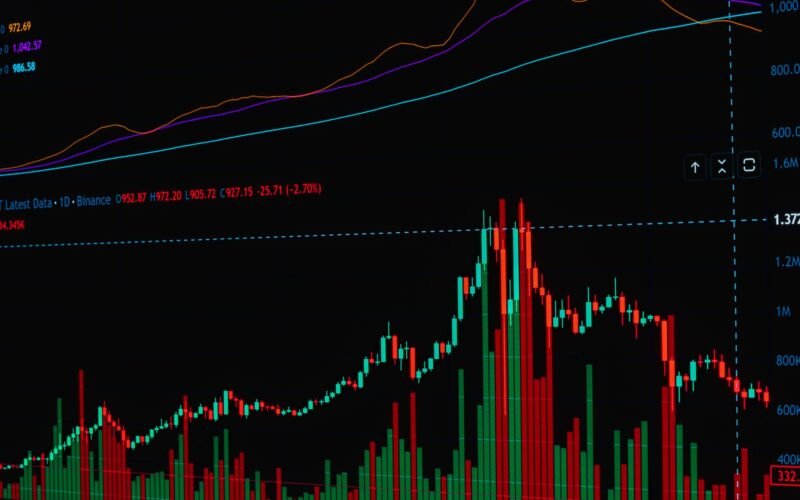
Volume is a critical confirmation indicator for breakouts. A genuine breakout is typically accompanied by a surge in trading volume, suggesting strong conviction from market participants. A breakout on low volume might be a ‘false breakout’, where the price briefly crosses the level before reversing.
Support and Resistance Levels
Support is a price level where buying pressure is strong enough to overcome selling pressure, halting a price decline. Resistance is a price level where selling pressure is strong enough to overcome buying pressure, halting a price advance. Breakouts occur when prices move decisively above resistance or below support.
Trendlines as Breakout Signals
Trendlines connect a series of price highs (in a downtrend) or lows (in an uptrend). A break above a descending trendline or below an ascending trendline can signal a reversal or the continuation of a larger trend, acting as a breakout point.
How to Trade Nifty and Bank Nifty Breakouts Effectively?
Trading breakouts involves entering a position when the price breaks through a key level, aiming to profit from the ensuing momentum. It requires discipline, risk management, and the use of appropriate entry, stop-loss, and target strategies.
Entry Strategies
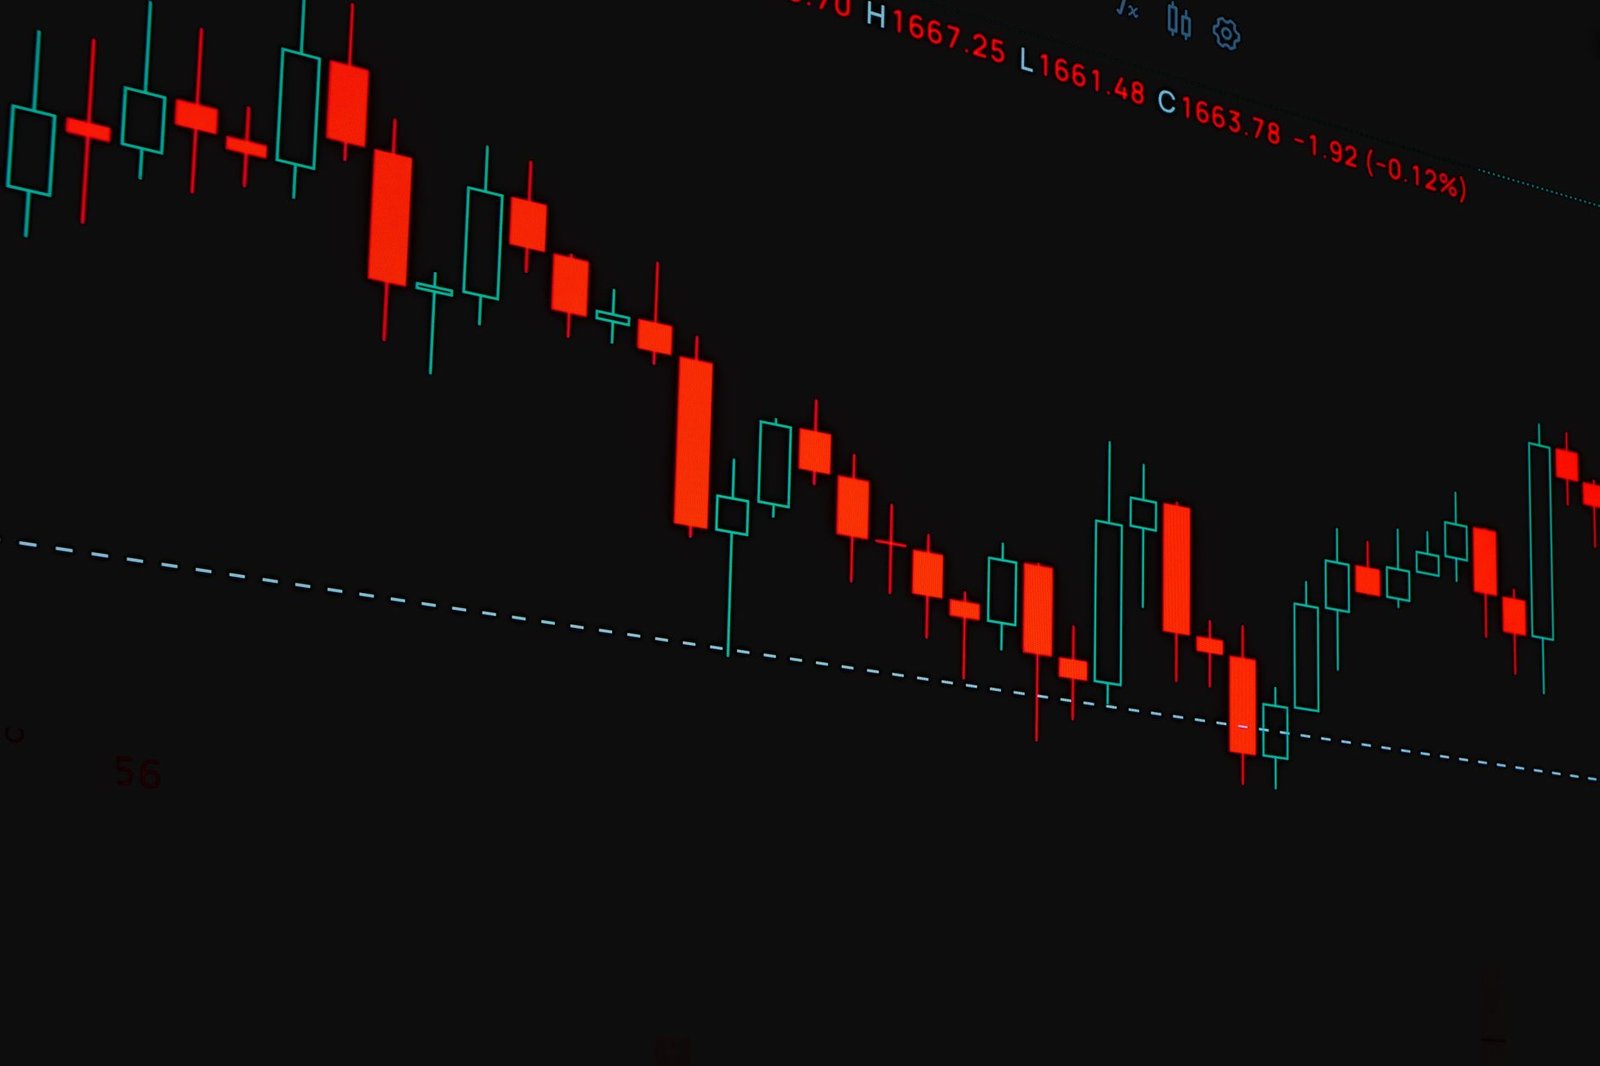
The most common entry strategy is to buy when the price closes decisively above a resistance level or sell when it closes decisively below a support level. Some traders prefer to wait for a brief retest of the broken level, which then acts as a new support or resistance, before entering.
Stop-Loss Placement
A crucial aspect of breakout trading is setting a protective stop-loss. For a long breakout, the stop-loss is typically placed just below the breakout level or below the recent swing low. For a short breakout, it’s placed just above the breakout level or above the recent swing high. This limits potential losses if the breakout fails.
Target Setting
Profit targets can be set using various methods, including previous support/resistance levels, chart pattern projections (e.g., the height of a triangle projected from the breakout point), or by using technical indicators like the Average True Range (ATR) to estimate potential price movement.
Risk Management Techniques
Never risk more than 1-2% of your trading capital on a single trade. Use wider stops for volatile instruments like Bank Nifty but ensure they align with your risk tolerance. Consider position sizing carefully based on your stop-loss distance to maintain consistent risk per trade.
Using a TradingView Indicator for Confirmation
Advanced traders often employ sophisticated tools. For instance, a custom TradingView indicator can be invaluable for identifying potential breakouts by highlighting key consolidation patterns and volume spikes automatically, saving time and improving accuracy. Many find our proprietary Trend Traders Tool incredibly useful for this.
Common Breakout Chart Patterns
Understanding common chart patterns that precede breakouts can significantly enhance a trader’s ability to anticipate market movements. These patterns offer visual cues about potential price direction following a consolidation phase.
Triangles (Ascending, Descending, Symmetrical)
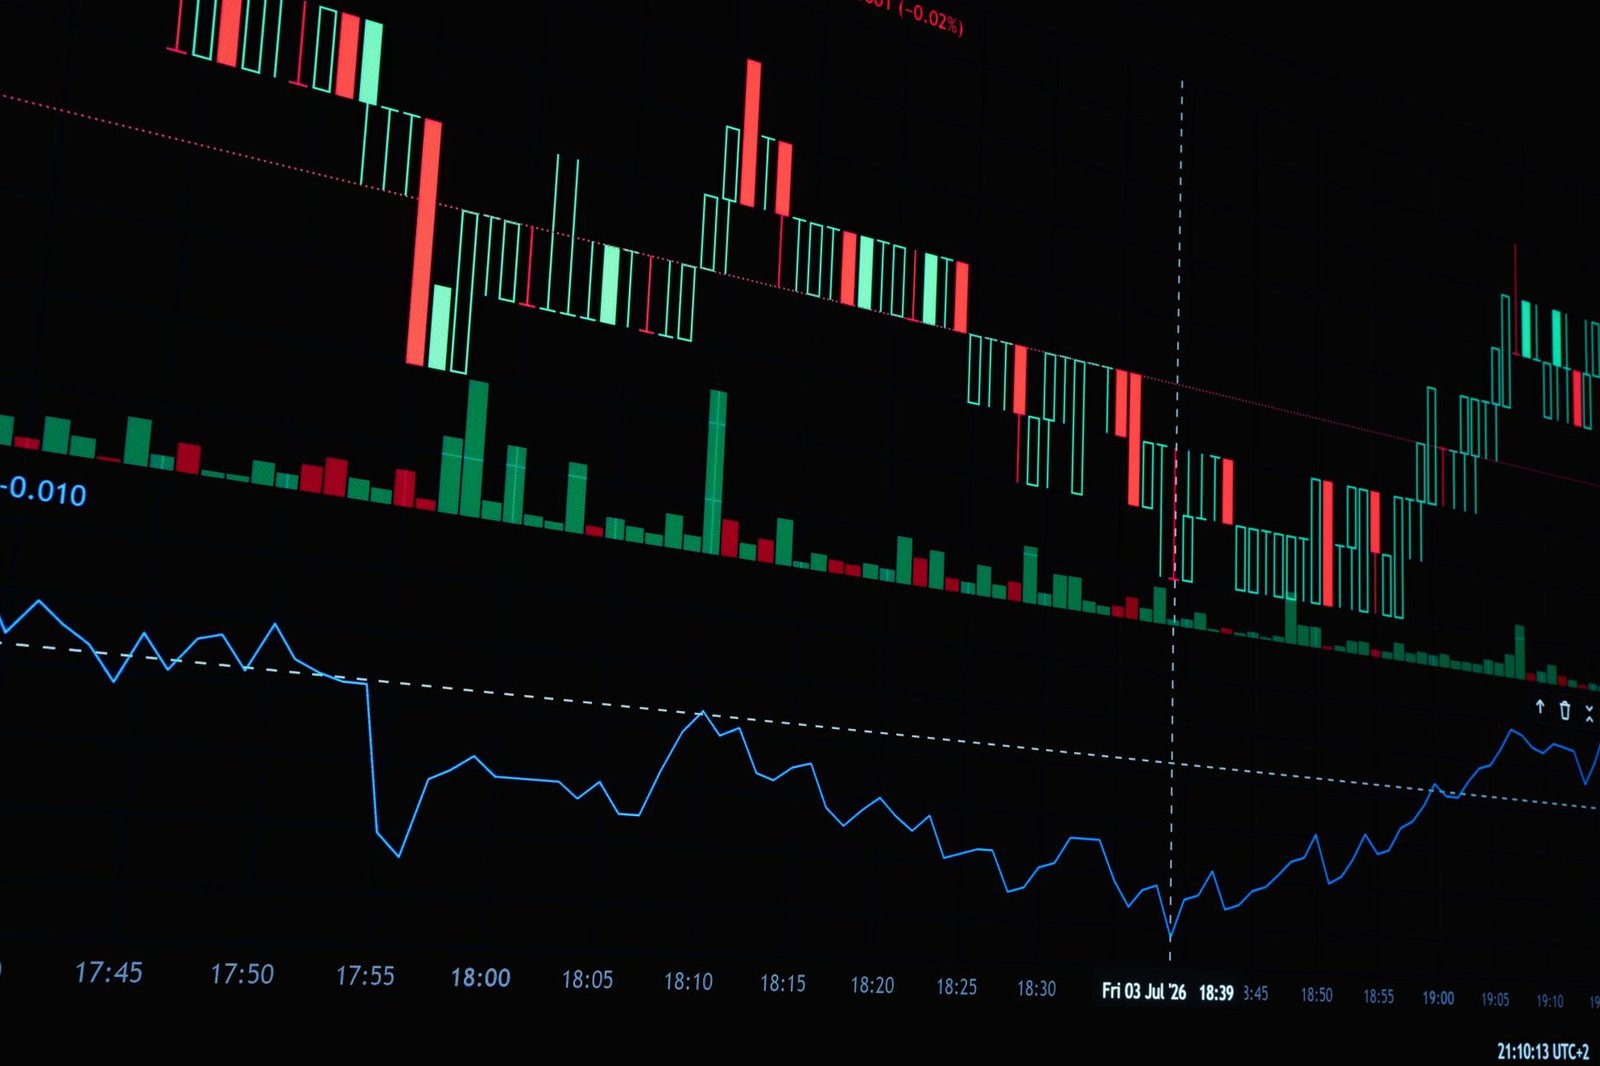
Triangles form when price fluctuations narrow, creating converging trendlines. An ascending triangle (flat top, rising bottom) often suggests an upside breakout, while a descending triangle (flat bottom, falling top) hints at a downside breakout. A symmetrical triangle indicates indecision, with the breakout direction being less predictable but often continuing the prior trend.
Rectangles and Channels
These patterns occur when price moves sideways between two parallel horizontal lines (support and resistance). A breakout above the upper resistance line signals a bullish move, while a break below the lower support line indicates a bearish move. These are often continuation patterns.
Flags and Pennants
Flags and pennants are short-term continuation patterns that form after a sharp price move (the ‘pole’). A flag resembles a small rectangle moving against the trend, while a pennant is a small symmetrical triangle. Both typically resolve in the direction of the prior sharp move.
Head and Shoulders (and Inverse)
The head and shoulders pattern is a reversal pattern. The ‘neckline’ support is crucial. A break below the neckline after the formation of the right shoulder signals a bearish breakout. The inverse head and shoulders pattern is a bullish reversal, with a breakout occurring above the neckline.
False Breakouts and How to Handle Them
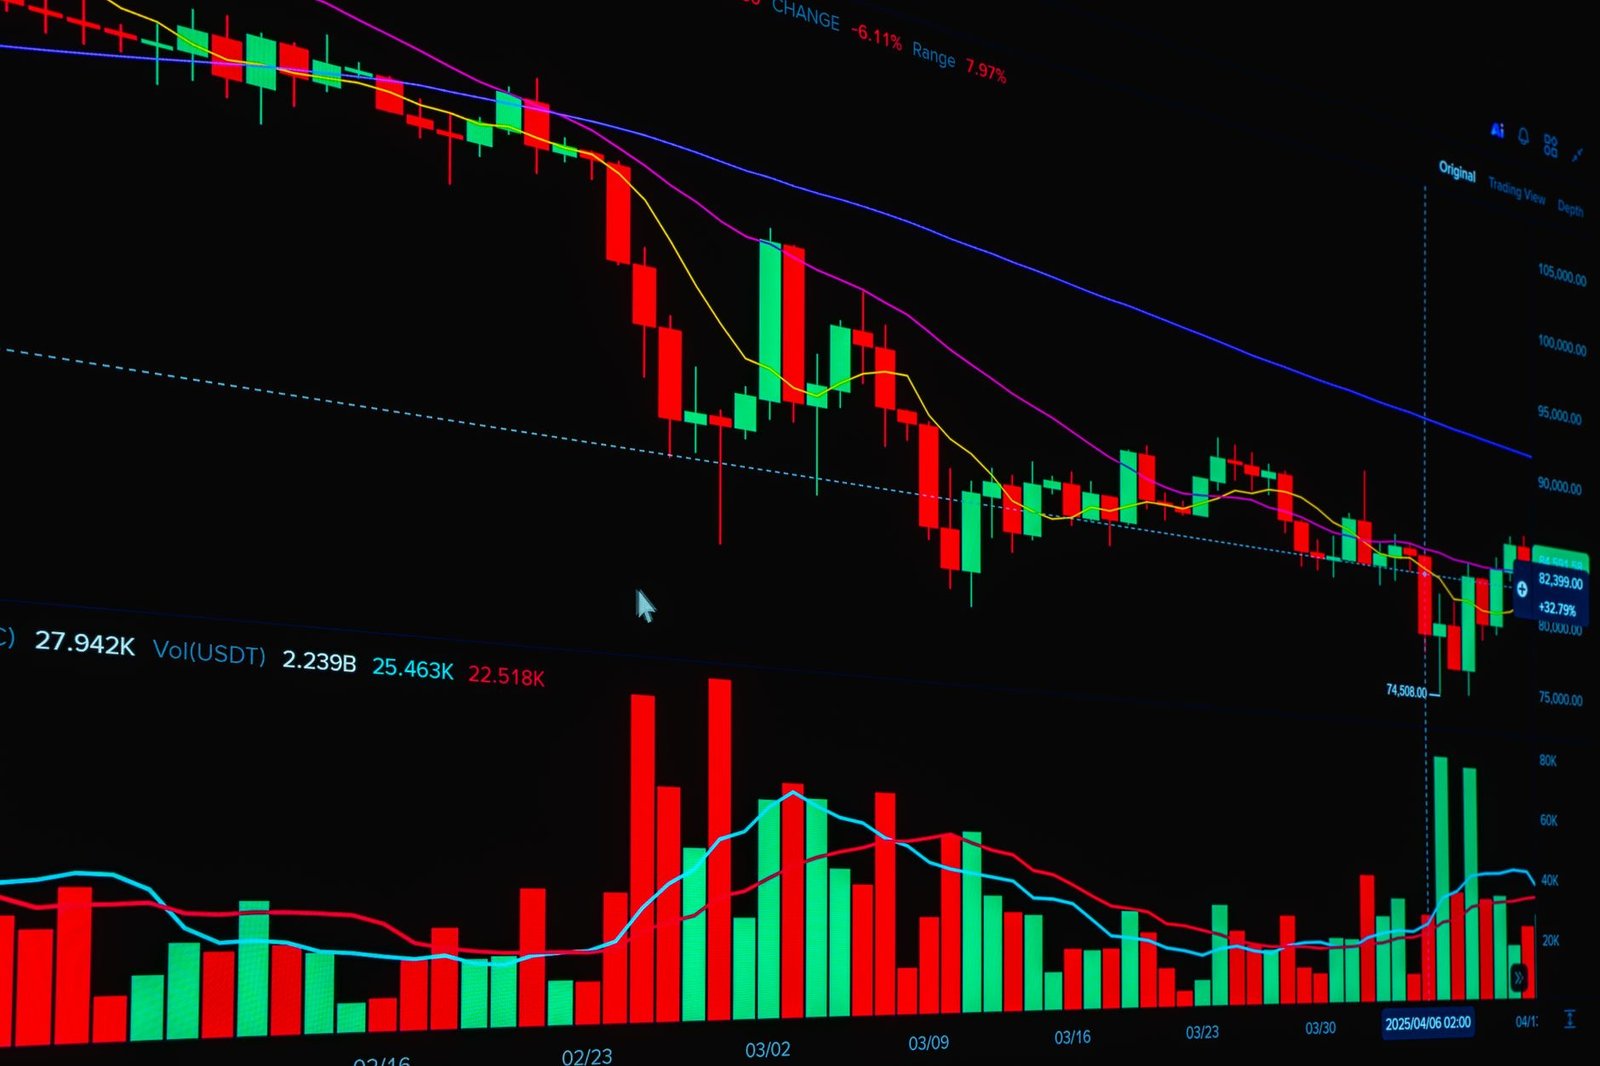
False breakouts, or ‘whipsaws’, occur when price briefly moves beyond a support or resistance level but then quickly reverses, trapping traders who entered positions based on the initial breakout. These are common and require robust risk management.
Identifying Potential False Breakouts
Look for breakouts that occur on low volume. A rapid reversal after the initial move can also be a sign. Sometimes, price might breach a level but fail to sustain the move for a full candle close on your chosen timeframe.
Strategies to Mitigate Risk
One strategy is to wait for confirmation – for instance, a second candle closing beyond the breakout level, or a retest of the broken level. Using wider stop-losses can also provide more room for price fluctuations without getting stopped out prematurely, though this increases risk per share. Trailing stop-losses can lock in profits as the trade moves in your favour.
When to Re-enter After a False Breakout
If a false breakout occurs and the price subsequently moves back into the previous range, traders might look for an entry in the opposite direction if the failed breakout confirms the prior range’s validity. For example, a failed upside breakout might present a shorting opportunity if price falls back below the resistance.
Breakout Trading for Nifty and Bank Nifty: A Practical Approach
Applying breakout strategies to highly liquid and volatile instruments like Nifty and Bank Nifty requires a disciplined approach. Given their tendency for sharp moves, proper planning and execution are paramount.

Choosing the Right Timeframe
Shorter timeframes (e.g., 5-minute, 15-minute) can offer more breakout opportunities but may also generate more false signals. Longer timeframes (e.g., hourly, daily) tend to provide more reliable breakouts with clearer patterns but fewer trading chances. Traders often combine multiple timeframes for analysis.
Leveraging Options for Breakout Plays
Options can be used to trade breakouts. Buying out-of-the-money call options can be profitable if Nifty or Bank Nifty makes a strong upward breakout, offering leveraged gains. Conversely, buying out-of-the-money put options can profit from sharp downside breakouts. However, options also decay over time, making precise timing crucial.
Backtesting Your Strategy
Before trading real money, it’s essential to backtest your breakout strategy on historical Nifty and Bank Nifty data. This helps validate its effectiveness and refine entry/exit rules. Many platforms, including TradingView, allow for historical data analysis.
How to Start Trading Breakouts (5 Steps):
- Identify a clear consolidation pattern on the Nifty or Bank Nifty chart (e.g., triangle, rectangle).
- Mark the key support and resistance levels or trendlines defining the pattern.
- Wait for the price to decisively break through the identified level with increased volume.
- Enter a trade in the direction of the breakout, placing a protective stop-loss just beyond the breakout level.
- Set a realistic profit target based on chart patterns, previous price levels, or ATR multiples.
- Monitor the trade closely and adjust stop-losses (e.g., trailing stop) as the price moves in your favour.
Frequently Asked Questions
What is the best indicator for breakout trading?
While no single indicator is perfect, volume is crucial for confirming breakouts. Moving averages (like the 20- or 50-day MA) can act as dynamic support/resistance, and indicators like the Relative Strength Index (RSI) can help gauge momentum or overbought/oversold conditions during a breakout.
How much volume is needed for a breakout?
A breakout is generally considered more reliable if accompanied by significantly higher volume than the average volume seen during the consolidation phase. While there’s no fixed number, a 50-100% increase in volume is often seen as a strong confirmation.
When should I exit a breakout trade?
Exit a breakout trade when your profit target is reached, your stop-loss is hit, or when you observe signs of the momentum fading, such as decreasing volume on a continuation move or the formation of reversal patterns.
Is breakout trading suitable for beginners?
Breakout trading can be profitable but carries significant risk due to false breakouts. Beginners should start with paper trading or small capital, focus on understanding chart patterns and risk management, and ideally use a reliable TradingView indicator for assistance.
Can I trade breakouts on different timeframes?
Yes, breakout trading can be applied to various timeframes, from intraday charts (5-minute, 15-minute) to daily and weekly charts. Breakouts on longer timeframes are generally more significant but occur less frequently.
What is the best chart pattern for breakouts?
While all patterns can lead to breakouts, symmetrical triangles and rectangles are often favoured for their clear, definable boundaries. Ascending and descending triangles can also offer good risk-reward ratios, especially if they align with the broader market trend.
Key Takeaways:
- Breakout trading aims to capture momentum after price breaches key support or resistance levels.
- Volume is a critical confirmation factor for genuine breakouts.
- Chart patterns like triangles, rectangles, flags, and pennants help identify potential breakout points.
- Proper stop-loss placement and risk management are essential to mitigate losses from false breakouts.
- Backtesting strategies on historical data is vital before deploying real capital.
- Consider using tools like a custom TradingView indicator to enhance signal identification.
- Breakouts in Nifty and Bank Nifty can be volatile, demanding strict discipline.
Trading involves substantial risk and may not be suitable for all investors. All investment decisions should be based on your own research and risk tolerance.





 Finovatives