TL;DR: Market cycles in the NSE and BSE move through predictable phases of accumulation, markup, distribution, and markdown, and recognizing these phases allows traders to adapt their strategies for better profitability and risk management.
Key Stats at a Glance:
- Nifty 50 has experienced multiple bull and bear cycles since its inception.
- BSE Sensex’s historical average annual return has varied significantly across different market cycles.
- The average duration of a market cycle can range from a few months to several years.
- Volatility tends to be higher during transitions between market phases.
- Over 7,000+ stocks are listed across NSE and BSE combined.
What are Market Cycles?
Market cycles are the recurring, though not perfectly predictable, patterns of expansion and contraction in financial markets, driven by shifts in investor sentiment, economic conditions, and corporate earnings.
Market cycles represent the natural ebb and flow of prices in stock exchanges like the NSE (National Stock Exchange) and BSE (Bombay Stock Exchange). These cycles are broadly characterized by four distinct phases: accumulation, markup, distribution, and markdown. Understanding these phases is fundamental for traders and investors aiming to navigate the complexities of the Indian stock market effectively. The NSE and BSE, being India’s premier stock exchanges, exhibit these cyclical behaviours prominently, influenced by a myriad of domestic and global economic factors, policy changes, and investor psychology.
The Four Phases of Market Cycles
Every market cycle can be broken down into four distinct phases: accumulation, markup, distribution, and markdown, each with unique characteristics and trading implications.
1. Accumulation Phase
This is the bottoming phase where smart money, such as institutional investors and experienced traders, begin to buy assets after a significant price decline, anticipating a future recovery. Prices tend to trade in a sideways range with low volume.
2. Markup Phase
Also known as the uptrend or bull market phase, this is when prices start to rise significantly, driven by increasing demand and positive sentiment. Volume typically expands, and new buyers enter the market.
3. Distribution Phase
This is the topping phase, mirroring accumulation, where smart money starts selling their holdings at inflated prices, distributing them to less informed late buyers. Prices often move sideways in a range, with increased volatility.
4. Markdown Phase
Also known as the downtrend or bear market phase, this is when prices begin to fall sharply due to increasing supply and negative sentiment. Volume can be high on down days, and fear starts to dominate.
How Do Market Cycles Affect NSE and BSE Trading?
Market cycles fundamentally dictate the prevailing trend and volatility, influencing the effectiveness of different trading strategies and risk management approaches on Indian exchanges.
The prevailing market cycle on the NSE and BSE profoundly impacts trading decisions by defining the dominant trend and the level of risk. During a markup phase, strategies focused on buying dips and holding (long-term investing) or riding the upward momentum tend to be most profitable. Conversely, during a markdown phase, short-selling or defensive strategies become more appropriate. Transitions between phases are often volatile and present significant risks, making it crucial for traders to adapt their approaches, position sizing, and stop-loss levels accordingly. Tools like TradingView indicators can be invaluable in spotting these shifts.
How to Identify Market Cycles
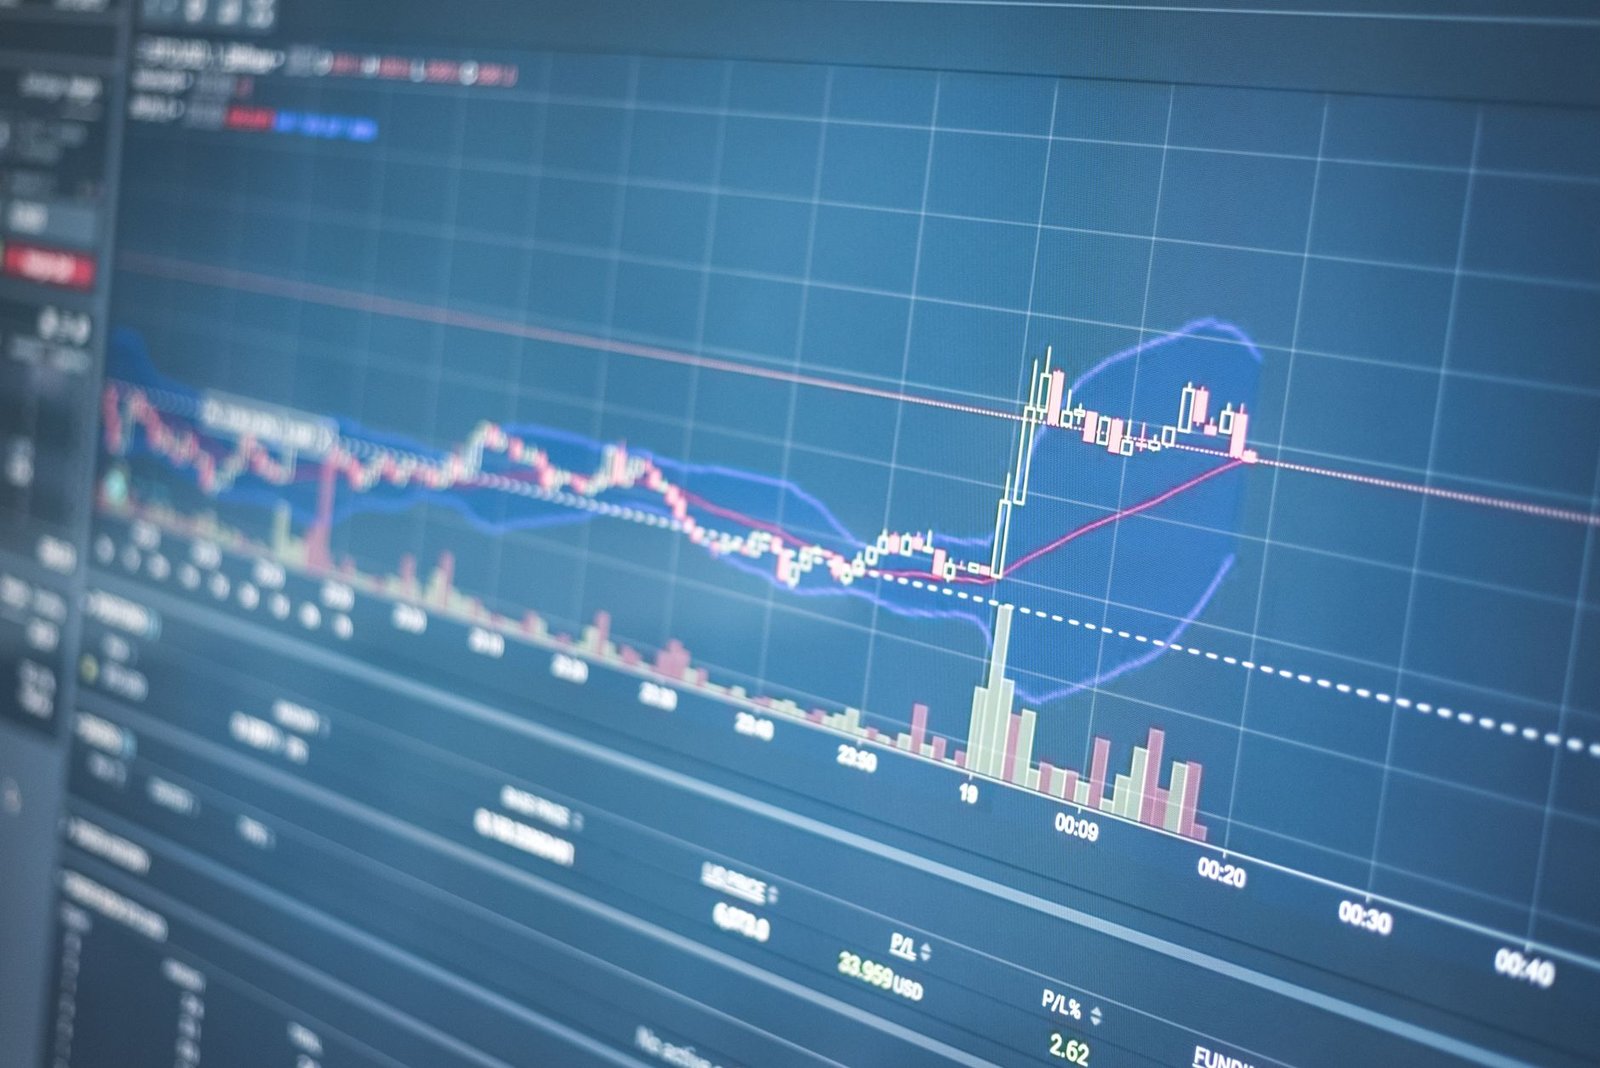
Identifying market cycles involves analysing price action, volume, market breadth, and fundamental economic indicators.
Traders and investors can employ various technical and fundamental analysis tools to gauge the current position within a market cycle. While no method is foolproof, a combination of indicators can provide a higher probability of correct assessment. This involves observing price patterns, volume trends, the performance of different market sectors, and macroeconomic data releases, all of which are critical for making informed trading decisions on the NSE and BSE.
How to Use Technical Analysis to Identify Cycles:
- Trend Identification: Use moving averages (e.g., 50-day, 200-day) to identify the primary trend. Prices consistently above moving averages suggest an uptrend (markup), while prices below suggest a downtrend (markdown).
- Volume Analysis: Observe volume patterns. Rising volume on up days and declining volume on down days can confirm an uptrend. Increasing volume on down days and decreasing volume on up days may signal a downtrend.
- Support and Resistance: Identify key support levels (potential accumulation zones) and resistance levels (potential distribution zones). Price behaviour around these levels provides clues about the cycle phase.
- Chart Patterns: Recognise classic chart patterns like head and shoulders (top reversal), double tops/bottoms, and flags/pennants, which often signal phase transitions.
- Oscillators: Use indicators like the Relative Strength Index (RSI) or MACD to identify overbought/oversold conditions that might precede a reversal or continuation.
- Market Breadth: Analyse the number of advancing stocks versus declining stocks. Broad-based advances support a markup phase, while widespread declines indicate a markdown.

Strategies for Different Market Cycles
Adapting trading strategies to the specific phase of the market cycle is key to capitalising on opportunities and mitigating risks.
Different market conditions favour different approaches. In a bull market (markup), trend-following strategies like ‘buy the dip’ or momentum trading are effective. In a bear market (markdown), short-selling or a defensive ‘cash is king’ approach might be prudent. During sideways or choppy markets (accumulation/distribution), range-bound trading or strategies that profit from low volatility could be considered. The Trend Traders Tool, for instance, is designed to help identify these shifts.
Trading in Accumulation and Distribution Phases
These sideways phases require patience and a focus on range-bound strategies or waiting for a clear breakout.
Trading in Markup and Markdown Phases
These trending phases favour momentum and trend-following strategies, with careful risk management paramount.
The Role of Fundamental Analysis in Cycles
While technical analysis helps identify the current phase, fundamental analysis provides context on the underlying economic and corporate health driving the cycle.
Understanding the broader economic landscape, interest rate policies from the RBI, corporate earnings growth, and sector-specific developments helps in assessing the sustainability of a particular market cycle phase. For instance, strong GDP growth and falling interest rates typically support a prolonged markup phase, while economic slowdowns and rising rates can precipitate a markdown. SEBI regulations also play a role in market stability, indirectly influencing cycle dynamics.
Navigating Market Cycles with Risk Management
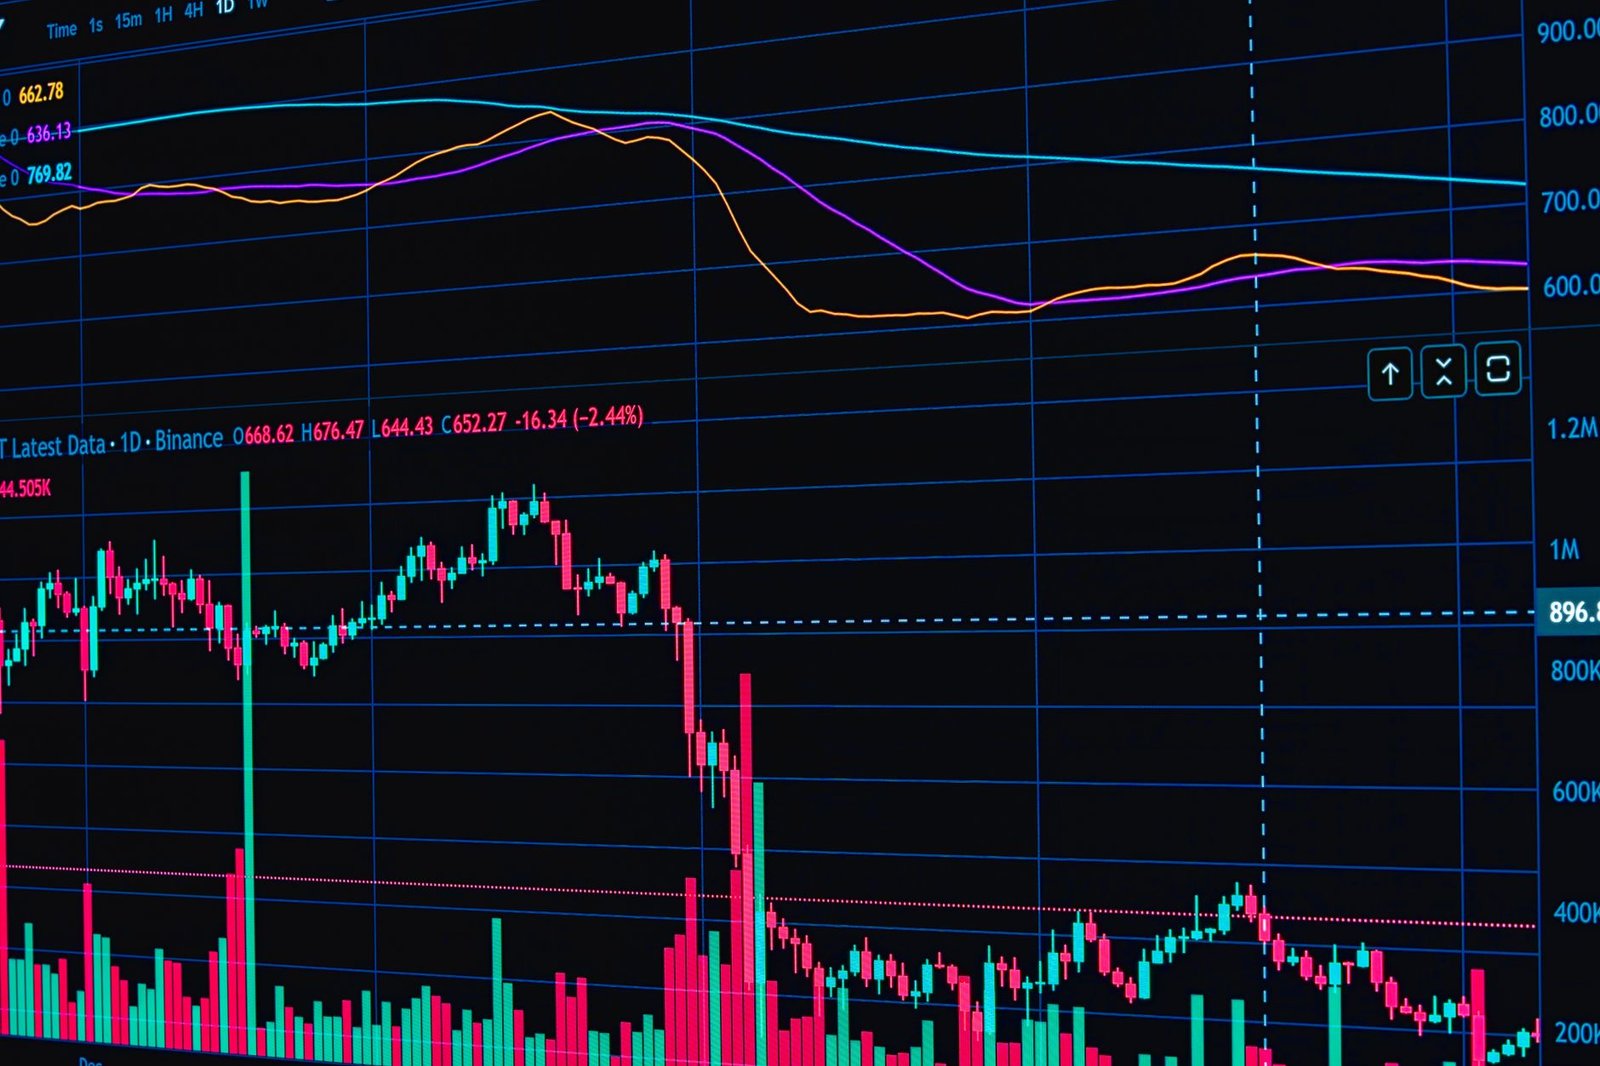
Effective risk management is non-negotiable and must be tailored to the prevailing market cycle phase.
During volatile periods or when anticipating phase transitions, it is crucial to reduce position sizes, tighten stop-loss orders, and avoid over-leveraging. In strong uptrends, wider stops might be permissible, while in downtrends or choppy markets, stops should be closer. Diversification across asset classes and sectors can also help cushion the impact of adverse movements within any given cycle phase.
Frequently Asked Questions
What is the most common market cycle duration?
There’s no fixed duration; market cycles can last from a few months to several years, influenced by economic cycles, technological shifts, and investor sentiment.
Can market cycles be predicted with certainty?
No, market cycles cannot be predicted with absolute certainty. They are patterns observed in retrospect and can be anticipated with varying degrees of probability using technical and fundamental analysis.
Which phase is best for long-term investing?
The accumulation phase is often considered ideal for long-term investors as assets are relatively undervalued, offering potential for significant capital appreciation during the subsequent markup phase.
How does economic news affect market cycles?
Economic news (e.g., inflation data, interest rate decisions, GDP reports) can trigger or accelerate shifts between market cycle phases by altering investor expectations and influencing corporate profitability.
What is the role of investor sentiment in market cycles?
Investor sentiment is a key driver. Euphoria often characterises the peak of a markup phase, while panic dominates the bottom of a markdown phase, both contributing to cyclical extremes.

Key Takeaways
- Market cycles consist of four phases: accumulation, markup, distribution, and markdown.
- Recognising these phases helps traders align strategies with prevailing market conditions on NSE and BSE.
- Technical analysis (trends, volume, patterns) and fundamental analysis (economic data, earnings) are crucial for identification.
- Risk management must be adapted to the cycle phase, with tighter controls during transitions and downtrends.
- Patience and discipline are essential for navigating market cycles successfully.
- Adapting strategies, from trend-following in markup to range-trading in accumulation, is vital for profitability.
Investing in the stock market involves inherent risks, and past performance is not indicative of future results.






 Finovatives