TL;DR: Fibonacci retracement is a powerful tool for Indian traders to identify potential support and resistance levels by applying key ratios derived from the Fibonacci sequence to a stock’s price movement, helping to predict potential reversals or continuations.
Key Stats at a Glance:
- The 61.8% Fibonacci retracement level is often considered the most significant.
- The 38.2% and 50% levels are also widely watched by traders.
- Fibonacci retracements are applied to the high and low of a significant price move.
- Over 75% of active traders use some form of technical analysis, including Fibonacci tools.
- Nifty 50 experienced significant volatility in recent years, making retracement analysis crucial.
What is Fibonacci Retracement?
Fibonacci retracement is a technical analysis method that uses a set of horizontal lines to identify potential support and resistance levels where prices are likely to pause or reverse, based on key ratios derived from the Fibonacci sequence.
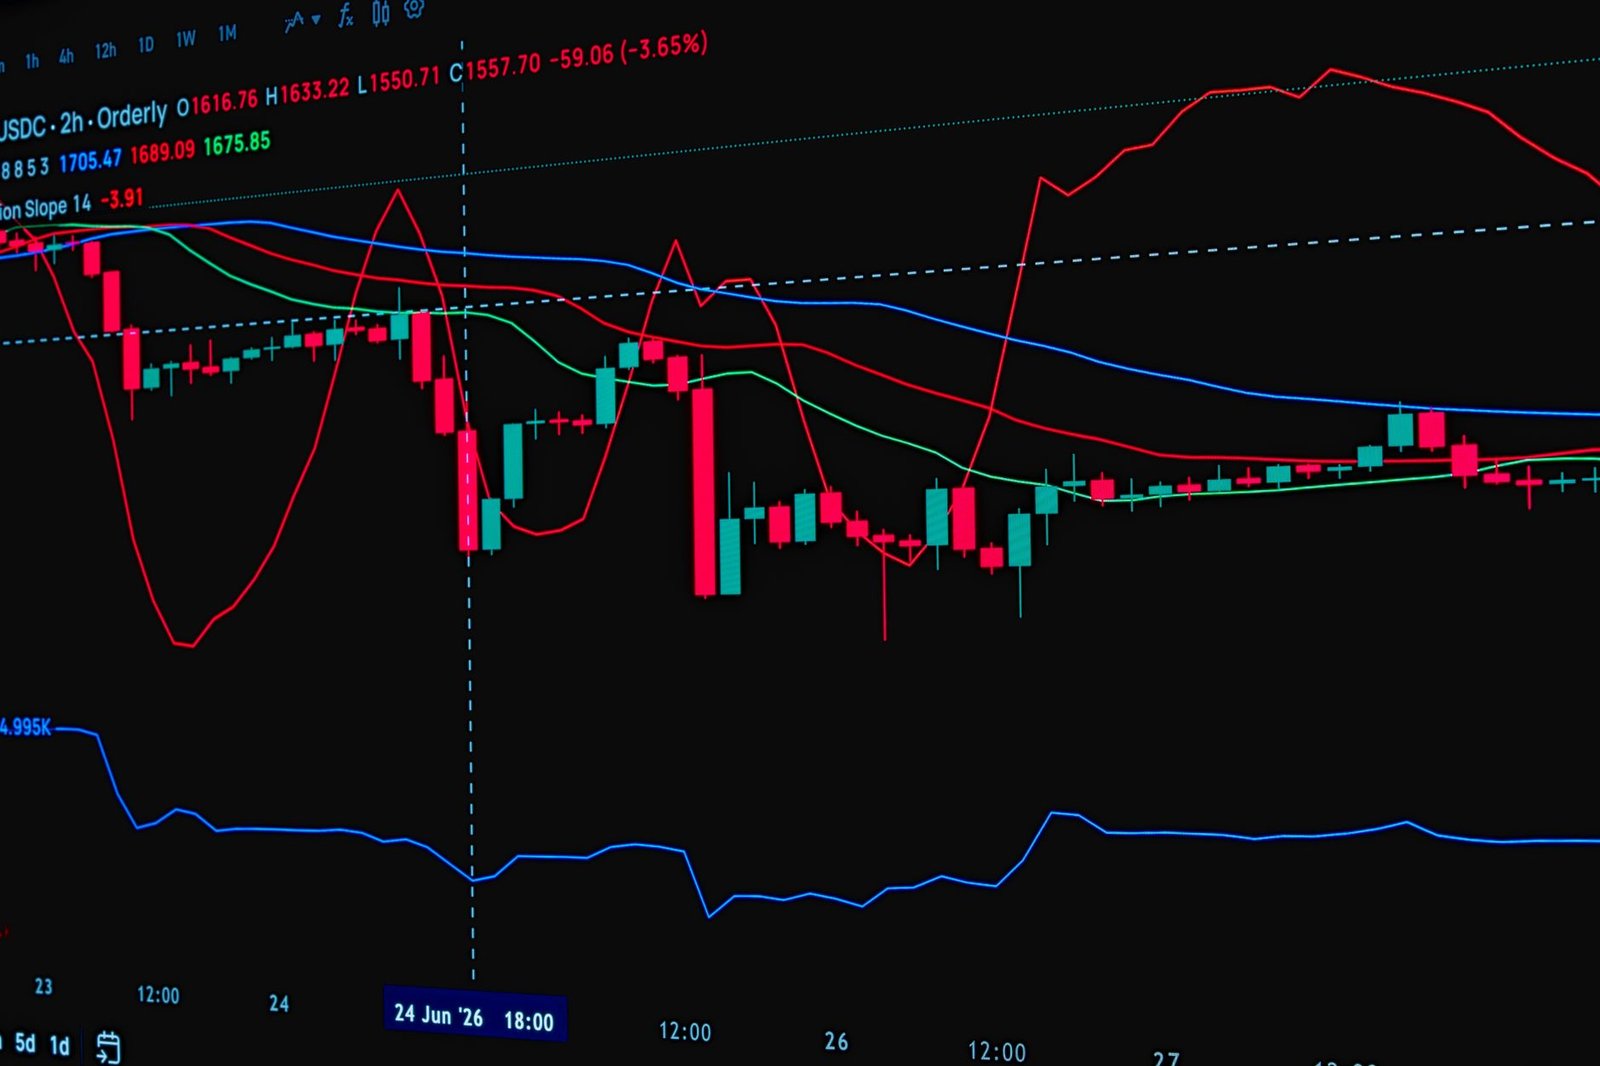
The concept of Fibonacci retracement stems from the famous Fibonacci sequence: 0, 1, 1, 2, 3, 5, 8, 13, 21, 34, and so on, where each number is the sum of the two preceding ones. While the sequence itself appears in nature, its application in financial markets is purely empirical. Traders and analysts noticed that after a significant price move (either up or down), prices tend to retrace a predictable portion of the original move before continuing in the original direction. These retracement levels are typically plotted at key ratios: 23.6%, 38.2%, 50%, 61.8%, and 78.6%. The 61.8% level, often called the ‘golden ratio’, is particularly watched. Understanding these levels can help Indian traders anticipate where a stock might find support after a decline or face resistance after a rally.
The Fibonacci Sequence and Its Ratios
The core of Fibonacci retracement lies in specific ratios derived from the sequence. These ratios are believed to represent natural levels of support and resistance. The most commonly used ratios are:
- 23.6%: A less significant retracement level.
- 38.2%: A more common retracement level.
- 50%: While not a true Fibonacci ratio, it’s often included as a psychological level where a market might find balance.
- 61.8%: Known as the golden ratio, this is often considered the most important retracement level.
- 78.6%: A deeper retracement level, also derived from the sequence.
Why Are These Ratios Important for Traders?
The underlying principle is that after a substantial price move, the market often corrects or ‘retraces’ a portion of that move. These Fibonacci levels act as potential price magnets where the retracement might halt and reverse. For Indian traders, this means that if a stock has been in a strong uptrend and starts to pull back, these retracement levels can signal potential buying opportunities. Conversely, if a stock is in a downtrend and rallies, these levels can indicate potential selling points or the end of a bounce. The NSE and BSE often show clear examples of these patterns.
How Does Fibonacci Retracement Work in Practice?
Fibonacci retracement is applied by drawing horizontal lines on a price chart at the key ratio levels between a significant price swing’s high and low point.
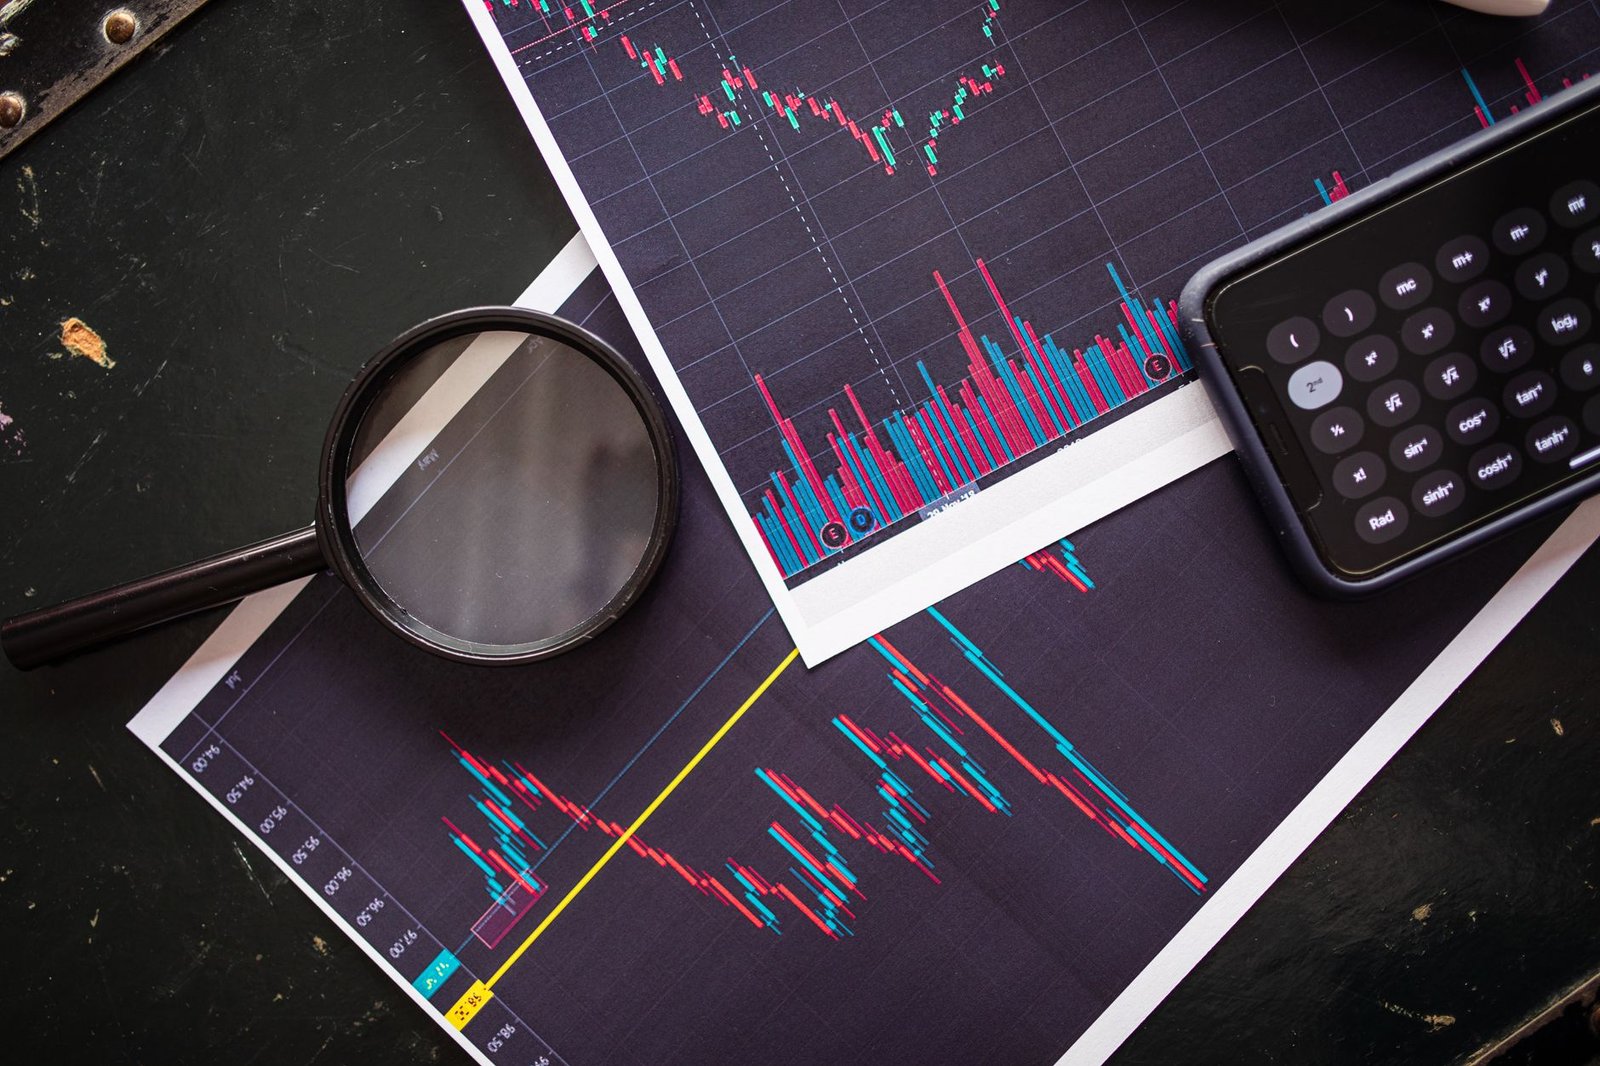
To use Fibonacci retracement effectively, you first need to identify a clear and significant price swing on your chart – this could be the high and low of a long-term trend or a shorter-term move. Most charting platforms, including those integrated with TradingView indicators, offer a Fibonacci retracement tool. You select the tool, click on the starting point of the swing (e.g., the low of an uptrend), and drag it to the ending point (e.g., the high of that uptrend). The software automatically draws horizontal lines at the key Fibonacci levels (23.6%, 38.2%, 50%, 61.8%, 78.6%) within that price range. Traders then watch these levels for signs of price reaction – a bounce off a level might confirm it as support, while a rejection from a level could indicate resistance.
Identifying the Swing High and Swing Low
The accuracy of Fibonacci retracement heavily relies on correctly identifying the relevant swing high and swing low. A ‘swing’ is generally defined as a significant peak or trough in price action. For longer-term analysis, you might use major trend highs and lows. For shorter-term trading, you might focus on the highs and lows of a few days or weeks. Experienced traders often look for clear price formations and avoid choppy or sideways markets when identifying these swings.
Drawing the Fibonacci Levels
Once the swing high and low are identified, the Fibonacci retracement tool is applied. For an uptrend, you draw from the swing low to the swing high. For a downtrend, you draw from the swing high to the swing low. The tool will then project the horizontal retracement levels between these two points. The 50% level, although not a strict Fibonacci number, is often included as it represents the halfway point of the move and is a common psychological level for traders.
Interpreting the Levels
Traders watch these levels to see how the price reacts. If a stock is pulling back in an uptrend and finds support at the 38.2% or 61.8% level, it can be a signal to consider a long (buy) position, expecting the uptrend to resume. Conversely, if a stock is bouncing in a downtrend and meets resistance at these levels, it might be a signal to consider a short (sell) position. Confirmation from other indicators, like volume or moving averages, is always recommended.
How to Use Fibonacci Retracement for Trading Decisions?
To effectively use Fibonacci retracement, traders should integrate it with other technical analysis tools and price action confirmation.
- Identify a Significant Price Swing: Look for a clear upward or downward price movement on your chosen timeframe.
- Select the Fibonacci Retracement Tool: Open your charting software and choose the Fibonacci retracement tool.
- Draw the Levels: Click on the swing low and drag to the swing high (for an uptrend), or click on the swing high and drag to the swing low (for a downtrend).
- Watch for Price Reactions: Observe how the price behaves when it approaches the Fibonacci levels (23.6%, 38.2%, 50%, 61.8%, 78.6%).
- Seek Confirmation: Look for other indicators or chart patterns that confirm a potential reversal or continuation at these levels. For example, a bullish candlestick pattern at a support level or increased trading volume can strengthen the signal.
- Set Entry, Stop-Loss, and Target Prices: Use the retracement levels to guide your trading plan. A common strategy is to enter a trade near a support level in an uptrend, with a stop-loss just below that level. Profit targets can be set at previous highs or further Fibonacci extension levels.
- Consider Other Tools: Combine Fibonacci retracement with moving averages, RSI, MACD, or support/resistance lines for more robust trading signals. Our Trend Traders Tool can complement these analyses.
- Practice on Paper/Demo Accounts: Before risking real capital, practice applying Fibonacci retracement on historical data or a demo account to build confidence and refine your strategy.
What are Fibonacci Extensions?
Fibonacci extensions are used to project potential price targets beyond the initial price swing, assuming that a retracement has completed and the price will move further in the original trend’s direction.
While retracements help identify potential reversal points within a previous move, extensions aim to predict how far a price might travel once it breaks out of that retracement phase and resumes its primary trend. They are drawn using three points: the start of the trend, the end of the trend (the swing high or low), and the end of the retracement (where the price reverses). The most common extension levels are 127.2%, 161.8%, 200%, and 261.8%. For instance, if a stock rallies to a new high, pulls back to the 61.8% retracement level, and then starts moving up again, traders might use Fibonacci extensions to set profit targets at levels like 161.8% or 261.8% of the initial move. These levels provide potential areas where the price might encounter resistance and an opportunity to exit profitable trades.
Fibonacci Extension Levels
The primary Fibonacci extension levels are calculated based on ratios derived from the Fibonacci sequence and are used to forecast potential price targets:
- 127.2%
- 161.8% (The Golden Ratio extension)
- 200%
- 261.8%
When to Use Extensions
Fibonacci extensions are particularly useful for setting profit targets after a trade has moved in your favour and has broken past the previous swing high (in an uptrend) or swing low (in a downtrend). They help traders remain in a winning trade for longer, aiming for more substantial profits, rather than exiting too early at minor resistance points.
Frequently Asked Questions
What is the most important Fibonacci retracement level?
The 61.8% level, often referred to as the ‘golden ratio’, is widely considered the most significant Fibonacci retracement level due to its frequent appearance as a strong support or resistance point.
Can Fibonacci retracement predict exact price points?
No, Fibonacci retracement levels are not exact predictors. They are probabilistic tools that indicate potential areas where price might react, but they require confirmation from other indicators and price action.
What is the difference between retracement and extension?
Retracements identify potential support/resistance levels within a prior price move, while extensions project potential price targets beyond that prior move, assuming the trend will continue.
How many points are needed to draw a Fibonacci retracement?
You need two points: the swing low and the swing high of a significant price move to draw the retracement levels. For extensions, you need three points: start of move, end of move, and end of retracement.
Is Fibonacci retracement effective in all markets?
Yes, Fibonacci retracement is a widely used tool across various markets, including equities (like those on NSE and BSE), forex, and commodities, as it’s based on perceived psychological price behaviour.
When should I use Fibonacci retracement?
Use Fibonacci retracement after a significant, clear price move (uptrend or downtrend) to anticipate potential turning points where the price might pause or reverse before continuing the original trend.
Key Takeaways
- Fibonacci retracement uses ratios like 38.2%, 50%, and 61.8% to identify potential support and resistance levels.
- It’s applied to significant price swings (highs and lows) on a chart.
- The 61.8% ‘golden ratio’ is often considered the most critical level.
- Confirmation from other technical indicators is essential for reliable trading signals.
- Fibonacci extensions project potential price targets beyond the initial move.
- It’s a popular tool among traders on Indian exchanges like NSE and BSE.
- Practice and integration with other tools enhance its effectiveness.
Trading involves risk. This information is for educational purposes only and not financial advice.



 Finovatives