


TL;DR: Moving average crossover strategies involve using two or more moving averages of different periods to generate buy and sell signals based on their intersections, helping Indian traders identify trend changes and potential entry/exit points.
Key Stats at a Glance:
- Nifty 50 recorded a CAGR of approximately 12.4% over the last decade (2014-2024).
- BSE Sensex comprises 30 large, well-established companies as of 2024.
- Over 5,000 companies are listed across NSE and BSE combined.
- The average trading volume on NSE can exceed 100 crore shares daily.
- SMA and EMA are the most commonly used moving averages by Indian traders.
What is a Moving Average Crossover Strategy?
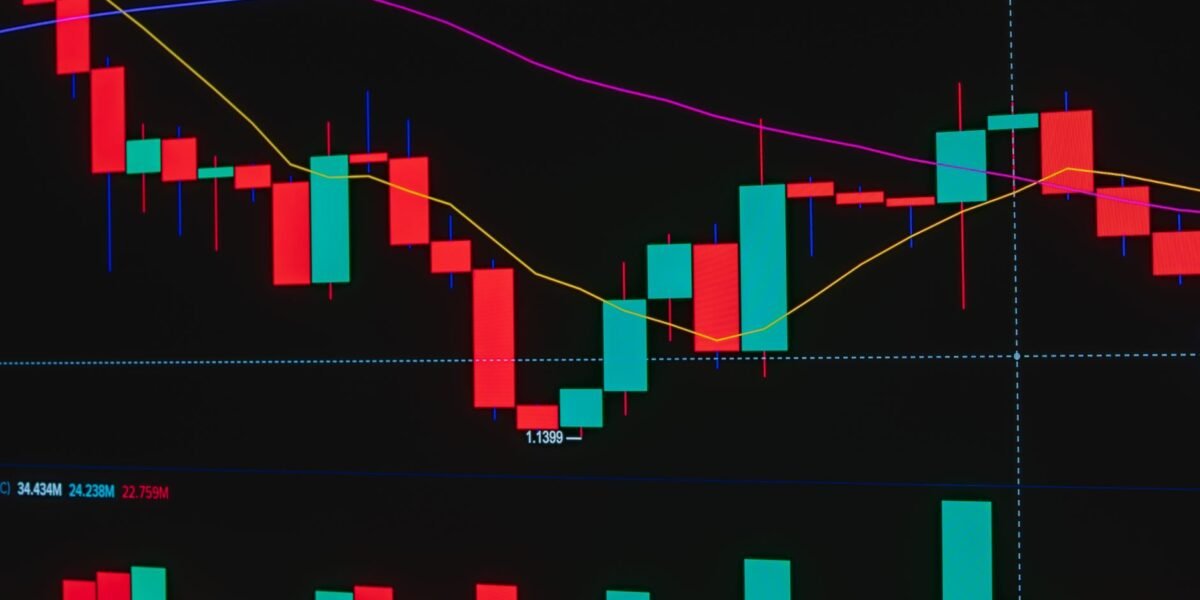
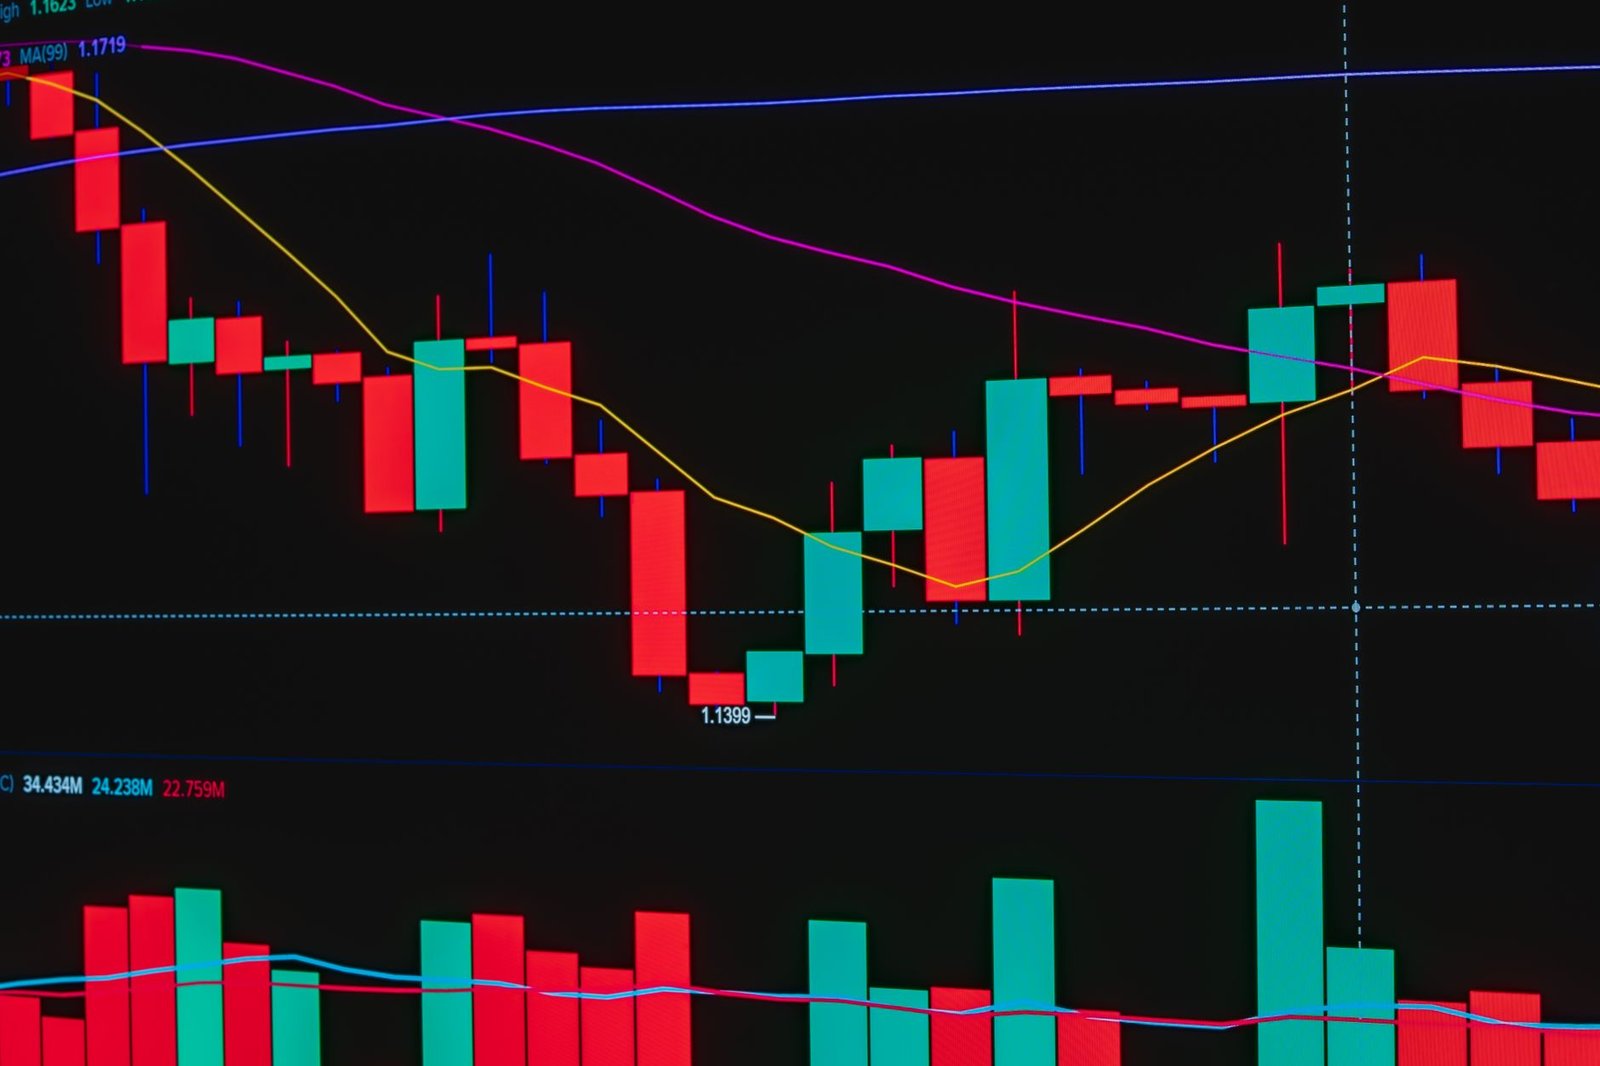
A moving average crossover strategy is a technical analysis approach where traders use the intersection of two or more moving averages (MAs) plotted on a price chart to generate trading signals. Typically, a shorter-period MA crossing above a longer-period MA signals a potential bullish trend, while a shorter-period MA crossing below a longer-period MA suggests a potential bearish trend.
Why Use Moving Average Crossovers for Indian Stocks?
Moving average crossovers are popular among Indian stock market traders because they offer a clear, objective method for identifying potential trend reversals and continuations. These signals can help traders enter positions when a trend is likely to begin and exit when it’s likely to end, thereby enhancing their ability to profit from market movements on platforms like NSE and BSE.
Identifying Trend Changes
The primary benefit of using moving average crossovers is their ability to signal potential shifts in market sentiment. When a faster-moving average (e.g., 20-day MA) crosses above a slower-moving average (e.g., 50-day MA), it indicates that recent prices are rising faster than older prices, suggesting upward momentum and a potential start of an uptrend. Conversely, a downward crossover often precedes a downtrend.
Simplicity and Clarity
Compared to complex indicator combinations, moving average crossovers are relatively straightforward to understand and implement. This simplicity makes them particularly attractive to new traders or those who prefer a less cluttered chart. The visual nature of the crossover event on the chart provides an easily identifiable trigger for action.
Versatility Across Timeframes and Assets
Moving average crossover strategies are not limited to specific timeframes or asset classes. Indian traders can apply them to intraday charts (e.g., 5-minute, 15-minute), daily charts, weekly charts, or even monthly charts for positional trading. They can be used across equities, futures, options, commodities on MCX, and even forex, making them a versatile tool in any trader’s arsenal.
How Does a Moving Average Crossover Work?
A moving average crossover works by comparing the direction and speed of price movements using two different time periods for moving averages. The shorter-period MA reacts more quickly to recent price changes, while the longer-period MA reflects the longer-term trend. When these two lines intersect, it signifies a change in the balance between short-term momentum and long-term trend, potentially indicating a new trend is forming.
Types of Moving Averages Used
The most common types of moving averages employed in crossover strategies are the Simple Moving Average (SMA) and the Exponential Moving Average (EMA). SMAs give equal weight to all prices within the period, making them smoother but slower to react. EMAs give more weight to recent prices, making them more responsive to price changes, which can lead to earlier signals but also more false signals.
Common Crossover Pairs
Several moving average combinations are popular among traders. Common pairs include:
- 5-day MA and 20-day MA
- 10-day MA and 30-day MA
- 20-day MA and 50-day MA
- 50-day MA and 200-day MA
The choice of MA periods often depends on the trader’s style (intraday, swing, positional) and the volatility of the specific stock or index being traded.
Popular Moving Average Crossover Strategies
Several well-established moving average crossover strategies can be adapted for the Indian stock market. These strategies differ primarily in the periods of the moving averages used, catering to different trading styles and market conditions.
The Golden Cross and Death Cross
The ‘Golden Cross’ typically occurs when a shorter-term MA (like the 50-day SMA) crosses above a longer-term MA (like the 200-day SMA). This is generally considered a strong bullish signal, suggesting a potential long-term uptrend. Conversely, the ‘Death Cross’ occurs when the shorter-term MA crosses below the longer-term MA, signaling a potential long-term downtrend. These are widely watched signals, particularly on major indices like the Nifty 50 and BSE Sensex.
The 5-20 Crossover Strategy
This strategy is popular among short-term traders and intraday traders due to the shorter periods of the moving averages. A buy signal is generated when the 5-day MA crosses above the 20-day MA. A sell signal is generated when the 5-day MA crosses below the 20-day MA. This strategy aims to capture short-term momentum swings.
The 20-50 Crossover Strategy
This strategy offers a balance between responsiveness and trend identification, making it suitable for swing traders. A buy signal is generated when the 20-day MA crosses above the 50-day MA, indicating that recent price momentum is strengthening. A sell signal occurs when the 20-day MA crosses below the 50-day MA, suggesting weakening momentum.

How to Implement a Moving Average Crossover Strategy
Implementing a moving average crossover strategy requires careful planning and execution. Traders should understand how to set up their charts, interpret the signals, and manage risk effectively.
- Choose your Trading Platform: Select a reliable trading platform that offers charting tools and allows you to add multiple moving averages. Platforms compatible with TradingView indicators are often preferred by Indian traders.
- Select Moving Average Periods: Decide on the periods for your shorter-term and longer-term moving averages based on your trading style (e.g., 5/20 for intraday, 20/50 for swing, 50/200 for positional).
- Add MAs to your Chart: Apply the selected SMAs or EMAs to the price chart of the Indian stock or index you are analyzing.
- Identify Crossover Signals: Watch for the shorter-term MA to cross above the longer-term MA for a potential buy signal, and below for a potential sell signal.
- Confirm with Price Action: It’s wise to confirm the crossover signal with other indicators or price action patterns to reduce false signals. Look for confirmation from volume or candlestick patterns.
- Set Stop-Loss Orders: Always place a stop-loss order to limit potential losses. For a buy signal, place the stop-loss below a recent swing low or the longer-term MA. For a sell signal, place it above a recent swing high or the longer-term MA.
- Determine Profit Targets: Decide on your profit target levels. This could be based on previous support/resistance levels, a fixed risk-reward ratio (e.g., 1:2), or by trailing your stop-loss as the trend progresses.
- Review and Adapt: Regularly review the performance of your strategy and make adjustments as needed based on market conditions and your trading results. Consider using a Trend Traders Tool for advanced analysis.
Challenges and Considerations for Indian Traders
While moving average crossovers are effective, they are not foolproof and come with specific challenges, especially in the dynamic Indian market.
Whipsaws in Sideways Markets
One of the biggest challenges is ‘whipsaws’ – false signals generated when the market is trading in a tight range or sideways. In such conditions, the shorter-term MA may repeatedly cross the longer-term MA, leading to a series of small losses if not managed properly with stop-losses.
Lagging Indicator Nature
Moving averages are inherently lagging indicators because they are based on past price data. This means that by the time a crossover signal is generated, a significant portion of the price move may have already occurred. This can lead to missed opportunities or entering trades at less favorable prices.
Over-Optimization Risk
Traders might be tempted to over-optimize their moving average periods to perfectly fit past data. However, what worked in the past may not work in the future. It’s crucial to test strategies on different market conditions and assets, and to stick to commonly used, logical periods rather than obscure ones.
Importance of Context and Other Indicators
Relying solely on moving average crossovers can be risky. Experienced traders often use them in conjunction with other technical indicators (like RSI, MACD) or chart patterns to confirm signals. Understanding the broader market context, news events, and the specific fundamentals of the Indian company is also vital for making informed decisions.
Frequently Asked Questions
What is the best moving average crossover for Indian stocks?
There isn’t a single ‘best’ crossover. Common effective pairs for Indian stocks include 5/20 for intraday, 20/50 for swing trading, and 50/200 for longer-term trends. The ideal choice depends on your trading style and risk tolerance.
When should I buy based on a moving average crossover?
You typically buy when a shorter-term moving average crosses *above* a longer-term moving average, signalling a potential upward trend. This is often confirmed by subsequent price action.
When should I sell based on a moving average crossover?
You typically sell when a shorter-term moving average crosses *below* a longer-term moving average, signalling a potential downward trend. This is often confirmed by subsequent price action.
How do I avoid false signals with moving average crossovers?
Avoid using crossovers in sideways markets. Confirm signals with other indicators like RSI or MACD, check volume, and wait for price action confirmation. Strict stop-loss usage is essential.
Are moving average crossovers effective for Nifty and Bank Nifty?
Yes, moving average crossovers are widely used and can be effective for indices like Nifty and Bank Nifty. They help identify the prevailing trend direction for these major market benchmarks.
Can I use moving average crossovers for fundamental analysis?
Moving average crossovers are tools of technical analysis, not fundamental analysis. While they help time entries and exits based on price trends, they don’t analyse a company’s intrinsic value, financials, or management quality.

Key Takeaways
- Moving average crossovers provide clear buy and sell signals by identifying intersections between short-term and long-term averages.
- Common strategies include the Golden Cross/Death Cross (50/200 SMA) and shorter-term pairs like 5/20 or 20/50.
- These strategies are versatile and can be applied across various timeframes and Indian market instruments.
- Implementation requires selecting appropriate MAs, charting tools, and setting strict risk management rules like stop-losses.
- Whipsaws in ranging markets and the lagging nature of MAs are key challenges to be aware of.
- Confirming crossover signals with price action and other indicators enhances reliability.
- Effective use requires understanding trading style, market context, and disciplined execution.
Trading in Indian stock markets involves inherent risks, and past performance is not indicative of future results. Consult with a SEBI-registered investment advisor before making any investment decisions.






 Finovatives