



TL;DR: Market breadth indicators, which measure the participation of stocks in a market move, offer crucial insights into underlying strength or weakness, helping Indian traders identify potential trend reversals and confirm price action before it’s reflected in major indices.
Key Stats at a Glance:
- The Advance-Decline Line (AD Line) is one of the oldest and most widely used breadth indicators.
- A breadth thrust occurs when a significant percentage of stocks move from oversold to overbought conditions rapidly, often signalling a strong bull run.
- During a significant market top, breadth indicators often diverge from price, with indices making new highs while fewer stocks participate.
- The NSE All Share Index has historically shown that when over 80% of its constituents are trading above their 200-day moving average, it signals a strong bull market.
- Volume analysis often complements breadth, with high volume on advancing stocks confirming upward momentum.
What are Market Breadth Indicators?
Market breadth indicators analyse the number of stocks participating in a market’s move, providing a measure of the overall health and participation driving price action in indices like the Nifty 50 or BSE Sensex.
Market breadth indicators are statistical measures used in technical analysis to gauge the overall strength or weakness of a stock market. Instead of just looking at the price movement of an index (like the Nifty 50 or BSE Sensex), breadth indicators delve deeper by examining the number of individual stocks that are advancing (making new highs or moving up) versus those declining (making new lows or moving down) on a given day or period. They help traders understand whether a market trend is broad-based and sustainable or narrow and potentially vulnerable to reversal. For Indian retail traders, understanding these indicators is vital for making more robust trading decisions beyond simply following the headline index movements.

Why is Market Breadth Important for Indian Traders?
Market breadth provides a crucial layer of confirmation or divergence against price action, helping traders assess the sustainability of market trends and avoid trading against underlying momentum.
For Indian traders operating in the dynamic NSE and BSE markets, market breadth indicators offer a vital perspective that price alone cannot provide. Often, an index might appear to be moving strongly in one direction, but this movement could be driven by a few large-cap stocks, while the majority of the market languishes. Breadth indicators reveal this hidden reality. If many stocks are participating in an upward move, it suggests strong underlying demand and a healthy bull market. Conversely, if an index is rising but fewer stocks are advancing, it signals a weakening market that may be prone to a correction. This insight is invaluable for confirming trade setups, identifying potential trend reversals early, and managing risk more effectively.
Confirming Price Trends
When an index makes a new high, and the breadth indicators also show a high number of advancing stocks, it confirms the strength of the uptrend.
Identifying Divergences
A divergence occurs when the index moves in one direction (e.g., making new highs) but the breadth indicators move in the opposite direction (e.g., showing fewer advancing stocks). This is a strong warning sign of a potential trend reversal.
Gauging Market Sentiment
Breadth indicators offer a real-time pulse check of investor sentiment across a wider segment of the market, moving beyond the sentiment of just a few dominant stocks.
Key Market Breadth Indicators to Watch
Several key indicators help analyse market breadth, each offering a unique perspective on stock participation and market health.
Understanding the nuances of different breadth indicators allows traders to build a more comprehensive picture of market dynamics. While no single indicator is perfect, using a combination can significantly enhance trading accuracy. For Indian traders, focusing on indicators readily available through platforms like TradingView can be particularly beneficial.
1. Advance-Decline Line (AD Line)
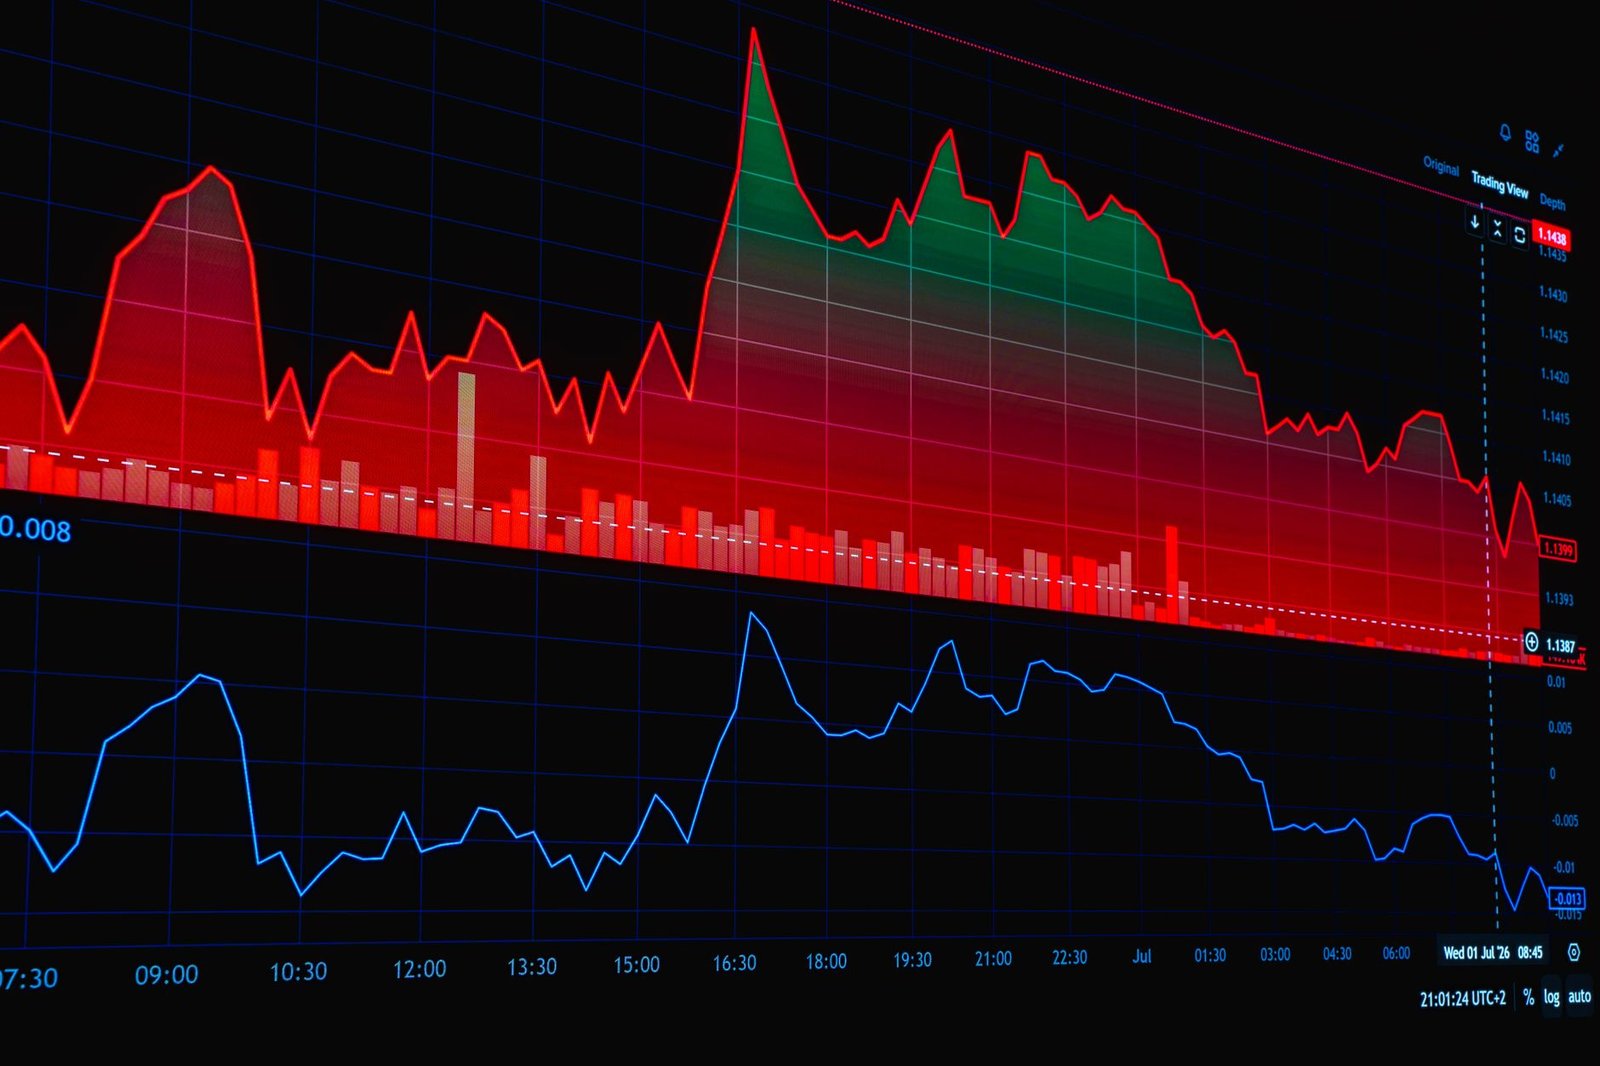
The AD Line is perhaps the most fundamental breadth indicator. It’s calculated by summing the net difference between advancing and declining stocks each day and plotting this cumulative total over time. A rising AD Line generally confirms an uptrend, while a falling AD Line confirms a downtrend. Divergences between the AD Line and market indices are crucial signals.
2. Advance-Decline Ratio (AD Ratio)
The AD Ratio provides a snapshot of the daily participation by dividing the number of advancing stocks by the number of declining stocks. A ratio significantly above 1 indicates more advancers than decliners, suggesting bullish sentiment. Ratios below 1 suggest bearish sentiment. Extreme ratios can signal overbought or oversold conditions.
3. New Highs-New Lows Index
This indicator compares the number of stocks reaching 52-week highs against those reaching 52-week lows. A high number of new highs supports a bull market, while a high number of new lows indicates a bear market. Like the AD Line, divergences between this index and the market index are significant warning signs.
4. Percentage of Stocks Above Moving Averages
This indicator measures the percentage of stocks in a market index (e.g., Nifty 50 constituents) that are currently trading above a specific moving average, typically the 50-day or 200-day moving average. A high percentage (e.g., over 70-80%) suggests a strong uptrend, while a low percentage indicates a weak market. The NSE often publishes such data, highlighting the strength of its broader market.
5. Volume Analysis
While not strictly a breadth indicator, volume is a critical component. High volume accompanying advancing stocks confirms buying interest, while high volume on declining stocks confirms selling pressure. Breadth analysis is often enhanced by considering volume trends.
How to Use Market Breadth Indicators in Your Trading Strategy
Integrating market breadth indicators into your trading requires a systematic approach, combining them with price action and other technical tools for confirmation.
Applying market breadth indicators effectively can significantly refine your trading strategy. It’s not about replacing price action but augmenting it with a deeper understanding of market internals. For instance, using a sophisticated TradingView indicator that incorporates breadth can streamline analysis, but understanding the underlying principles is paramount. This approach is particularly useful for swing traders and position traders who need to assess the sustainability of trends.
- Choose Your Indicators: Select 2-3 core breadth indicators that resonate with your trading style (e.g., AD Line and Percentage of Stocks Above Moving Averages).
- Monitor Daily: Track these indicators daily for the markets and indices you trade (e.g., Nifty 50, BSE Sensex, specific sectoral indices).
- Look for Confirmation: Use breadth indicators to confirm the direction and strength suggested by price action. If the Nifty 50 is rising, check if the AD Line and the percentage of stocks above their moving averages are also rising.
- Identify Divergences: Be alert for divergences. If the index is making new highs but breadth indicators are weakening, consider reducing long positions or looking for shorting opportunities.
- Combine with Other Tools: Use breadth indicators in conjunction with other technical analysis tools like support/resistance levels, chart patterns, and momentum oscillators (e.g., RSI, MACD).
- Consider Volume: Always factor in trading volume. Strong price moves on high volume are more significant than those on low volume.
- Adjust Position Sizing: Use breadth signals to adjust your position sizing. Strong breadth might justify larger positions, while weak breadth could warrant smaller, more cautious trades.

Interpreting Divergences for Actionable Insights
Divergences between price and breadth indicators are some of the most powerful signals for anticipating trend changes.
A divergence is a critical warning signal that the current price trend may be losing momentum and is susceptible to a reversal. When the stock market indices are pushing higher, but fewer stocks are participating (as shown by a declining AD Line or a falling New Highs-New Lows Index), it suggests that the rally is becoming narrow and is supported by a shrinking number of companies. This is a bearish divergence. Conversely, if an index is falling, but the number of declining stocks is decreasing or the AD Line is starting to tick up, it indicates that selling pressure is abating, potentially signalling a bottom. Acting on these divergences often involves waiting for price confirmation, but they provide an early heads-up to adjust trading strategies, perhaps by tightening stop-losses on existing positions or preparing to enter new trades in the anticipated new direction. This proactive approach is key for capitalising on reversals and avoiding significant losses.
Bullish Divergence Example
The Nifty 50 makes a lower low, but the AD Line makes a higher low, suggesting underlying buying interest is increasing despite the index’s dip.
Bearish Divergence Example
The BSE Sensex makes a higher high, but the AD Line makes a lower high, indicating that fewer stocks are participating in the rally, signalling potential weakness.
When to Be Cautious with Breadth Signals
While powerful, breadth indicators are not infallible and can provide false signals, especially in choppy or highly volatile markets.
It’s crucial for Indian traders to understand that market breadth indicators, like all technical tools, have limitations. In highly volatile or range-bound markets, breadth can sometimes give misleading signals. For instance, during periods of significant index manipulation or when a few dominant stocks heavily influence index movements, breadth might not accurately reflect the sentiment of the broader market. Therefore, it’s always advisable to use breadth indicators as part of a multi-faceted analysis rather than relying on them in isolation. Confirming breadth signals with price action, volume, and other indicators can help filter out false signals and improve the reliability of your trading decisions. For traders looking for advanced tools, a robust TradingView indicator might offer composite breadth metrics, but a foundational understanding remains key.
Short-Term vs. Long-Term Trends
Short-term breadth readings can be noisy; focus on longer-term trends for more reliable signals.
Market Conditions
Breadth signals are most reliable in clearly trending markets, less so in sideways or highly news-driven environments.
Overbought/Oversold Extremes
Extreme readings on breadth indicators can persist for some time, so don’t jump to conclusions solely based on an extreme level.

Frequently Asked Questions
What is the most common market breadth indicator?
The Advance-Decline Line (AD Line) is the most common and fundamental market breadth indicator, tracking the cumulative difference between advancing and declining stocks.
Can market breadth predict market tops and bottoms?
While not a perfect predictor, divergences between market breadth and price are strong warning signs that can help anticipate potential market tops and bottoms.
How many stocks should be advancing for a healthy uptrend?
Ideally, a healthy uptrend sees a high percentage of stocks participating. Many analysts consider over 70-80% of stocks above their 50-day moving average as a sign of broad strength.
When is market breadth considered weak?
Market breadth is considered weak when an index is rising but the number of advancing stocks is falling, or when a majority of stocks are declining despite the index holding steady.
How can I access market breadth data for Indian markets?
Market breadth data, such as the Advance-Decline Line and ratios, can often be found on financial websites, through brokerage platforms, and specialised charting software like TradingView, sometimes via custom indicators.
Key Takeaways
- Market breadth indicators provide a deeper understanding of market health beyond index price action.
- The Advance-Decline Line, AD Ratio, and Percentage of Stocks Above Moving Averages are essential tools for assessing breadth.
- Divergences between price and breadth indicators are crucial signals for potential trend reversals.
- Use breadth indicators to confirm trends and identify weaknesses for more robust trading decisions.
- Combine breadth analysis with price action, volume, and other technical tools for optimal results.
- Be aware of the limitations and potential for false signals, especially in volatile or range-bound markets.
Trading in stock markets involves inherent risks, and past performance is not indicative of future results. Investors are advised to conduct their own research and consult with a financial advisor before making investment decisions.



 Finovatives