


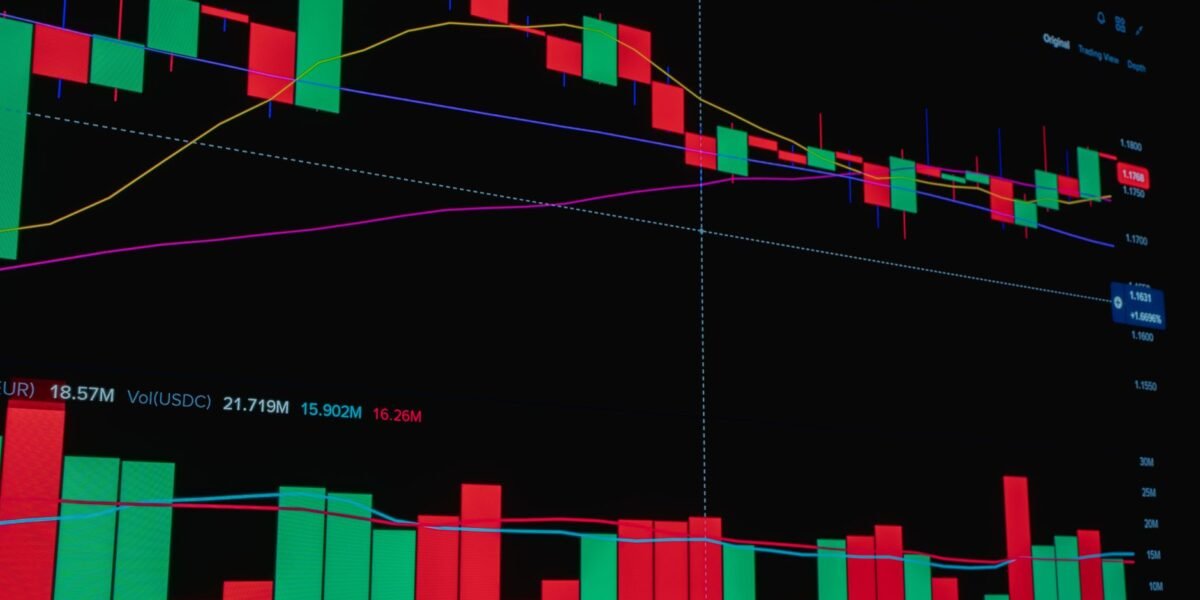
TL;DR: Strong net buying by FIIs and DIIs often correlates with Nifty 50 uptrends, while consistent selling can signal downward pressure, making their activity a key sentiment indicator for Indian market participants.
Key Stats at a Glance:
- Nifty 50’s average daily trading volume often sees significant contribution from FII/DII trades.
- As of recent data, FIIs hold a substantial portion of India’s equity market capitalization.
- DIIs, comprising mutual funds and insurance companies, have consistently increased their AUM, indicating growing domestic participation.
- In 2023, Nifty 50 experienced significant volatility influenced by global and domestic institutional flows.
- SEBI regulations govern the activities and disclosure norms for both FIIs and DIIs.
What are FIIs and DIIs?
Foreign Institutional Investors (FIIs) are overseas entities, including foreign mutual funds, pension funds, and investment banks, that invest in Indian securities. Domestic Institutional Investors (DIIs) are Indian entities like mutual funds, insurance companies, banks, and financial institutions that invest in Indian securities.
How does FII and DII activity impact the Nifty 50?
The trading activity of FIIs and DIIs significantly impacts the Nifty 50 because their large transaction sizes can move market prices, influence overall market sentiment, and signal potential future market direction due to their informed investment strategies.
FIIs: The Global Players
FIIs bring substantial capital from abroad, making their investment decisions highly influential. When FIIs are net buyers, it suggests confidence in the Indian economy and specific stocks within the Nifty 50, often leading to upward price movements. Conversely, when they turn net sellers, it can indicate a risk-off sentiment or a perceived overvaluation, potentially triggering a market decline. Their movements are closely watched as they often react to global economic cues and domestic policy changes. Understanding their flow is crucial; for instance, a consistent buying trend by FIIs in the last quarter of 2023 provided a strong support base for the Nifty 50.
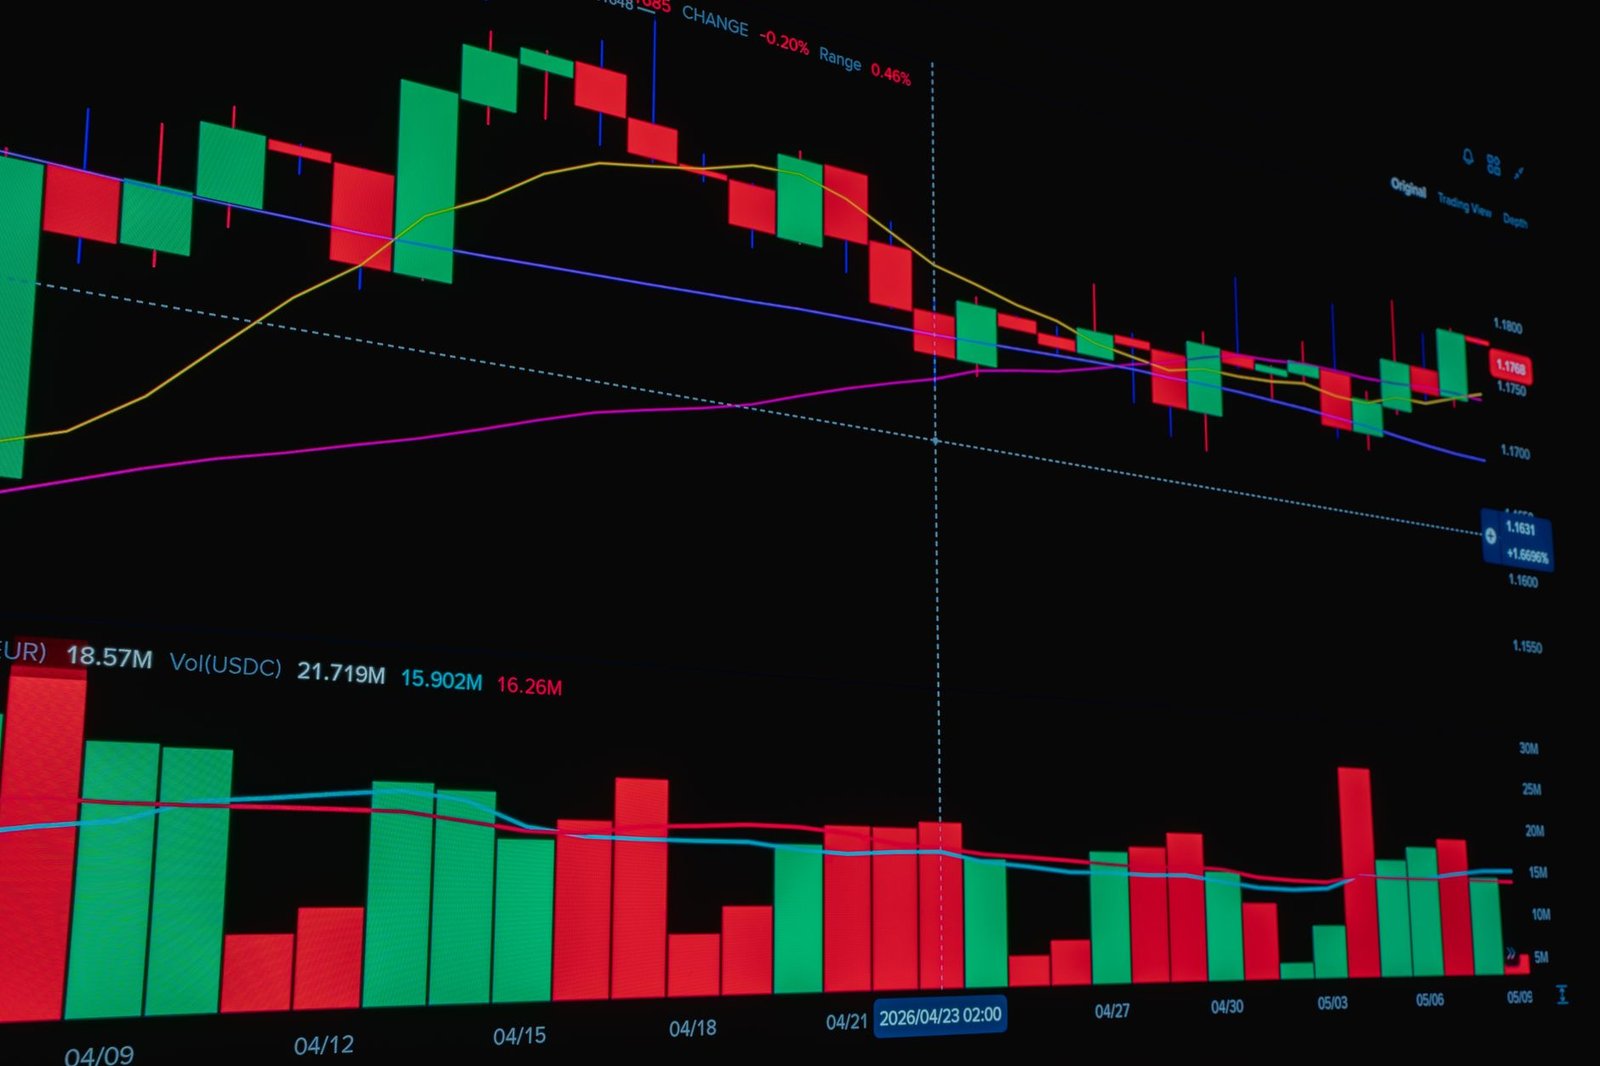
Chart showing FII net inflows/outflows against Nifty 50 movement.
DIIs: The Domestic Powerhouse
DIIs, backed by Indian savings channeled through mutual funds, insurance, and banks, represent domestic capital. Their increasing Assets Under Management (AUM) means their collective buying and selling power is substantial. DIIs often act as a counter-balance to FII flows. When FIIs sell heavily, DIIs tend to step in as buyers, absorbing the selling pressure and providing stability to the Nifty 50. Their investment philosophy is generally more long-term, focusing on fundamental value. The steady accumulation of assets by AMFI-registered mutual funds, for example, has been a persistent factor supporting Indian equities.
The Interplay: FII vs. DII
The dynamic between FII and DII activity is a key determinant of short-to-medium term Nifty 50 trends. A scenario where both FIIs and DIIs are consistently buying indicates strong conviction across both global and domestic institutional investors, typically leading to robust market rallies. However, divergences are common; FIIs might be selling due to global factors while DIIs are buying to capitalize on perceived undervaluation, creating complex market conditions. Traders often look for confirmation from both camps. For example, if both FIIs and DIIs show net buying on a given day, it’s often seen as a bullish signal for the Nifty 50.
Impact on Volatility and Sentiment
High volumes from FIIs and DIIs can amplify market movements. Large buy or sell orders can cause sharp spikes or drops, increasing intraday and overall market volatility. Their actions also shape broader market sentiment. Consistent buying by institutions generally boosts investor confidence, encouraging retail participation. Conversely, sustained selling can create fear and uncertainty. This sentiment shift is often reflected in options trading activity, particularly in the Nifty 50 index options segment, where institutional positioning can be inferred.

Infographic illustrating FII and DII investment types.
How to Interpret FII/DII Data for Trading
Interpreting FII and DII data requires understanding its nuances and not treating it as a sole trading signal. It’s most effective when combined with technical analysis and broader market indicators.
- Access Daily Data: Obtain daily net buying/selling figures for FIIs and DIIs from the NSE (National Stock Exchange) website or reliable financial news portals.
- Track Trends, Not Just Daily Numbers: Look for consistent buying or selling over several days or weeks rather than reacting to single-day figures. A trend indicates a more entrenched strategy.
- Correlate with Nifty 50 Movement: Observe how the Nifty 50 index moves in conjunction with FII/DII flows. Does buying precede rallies? Does selling precede declines?
- Consider the Context: Analyze the macroeconomic environment, global events, and domestic policy news. FII/DII actions are often reactions to these broader factors.
- Differentiate FII vs. DII: Understand whether the flow is dominated by FIIs or DIIs, as their motivations and time horizons can differ. DII buying can be more stable support.
- Use as a Confirmation Tool: Integrate FII/DII trends with your existing technical analysis, such as support/resistance levels, moving averages, or patterns identified using a TradingView indicator.
- Monitor Derivatives Data: Check institutional activity in index futures and options, as this often precedes or confirms cash market movements.
- Be Aware of Lag: Recognize that published data often has a slight lag, and market prices may have already moved in anticipation of or reaction to these flows.
Using FII/DII Data with Technical Indicators
While FII/DII data provides a fundamental flow perspective, combining it with technical analysis offers a more robust trading approach. For instance, if FIIs are showing strong net buying and the Nifty 50 is approaching a key support level identified by a technical indicator, it strengthens the case for a potential bounce. Conversely, if FIIs are consistently selling and the Nifty 50 breaks a crucial support level, it signals a higher probability of further downside. Tools like the Trend Traders Tool can help identify these confluence points where institutional flows align with technical signals.
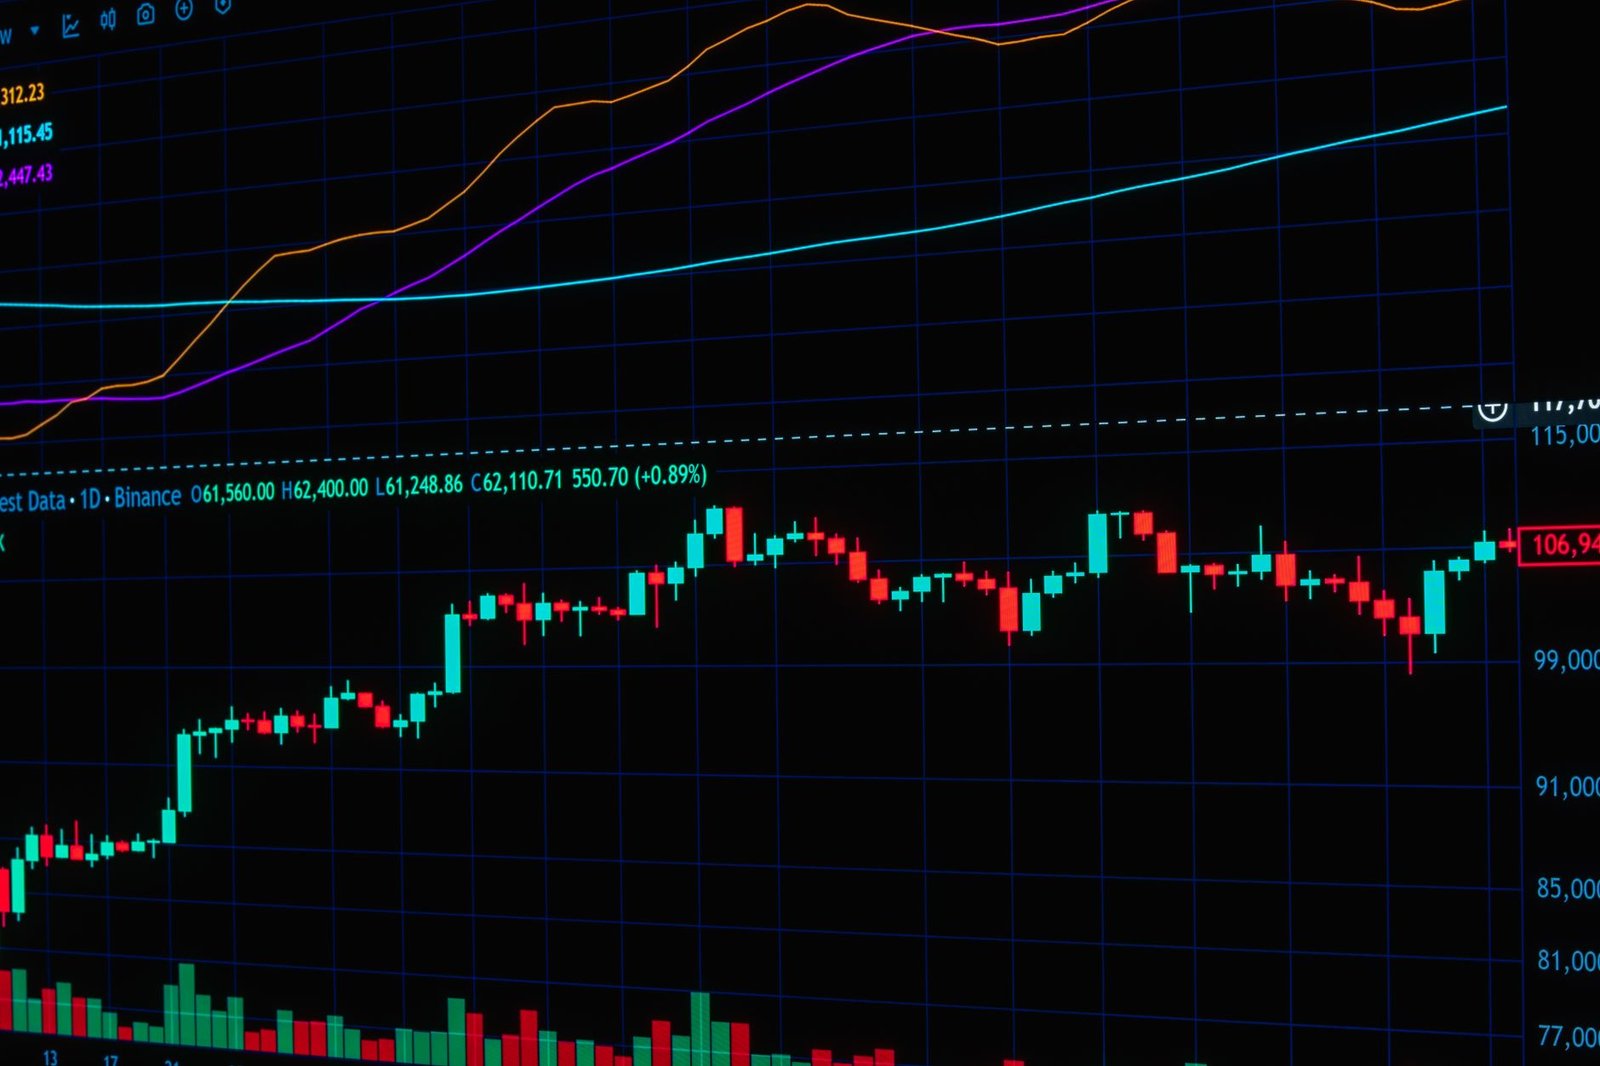
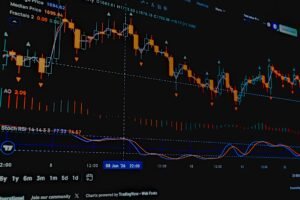
Screenshot of a trading platform showing FII/DII data alongside Nifty 50 chart.
Limitations of Relying Solely on FII/DII Data
It’s crucial to understand that FII/DII data is not infallible. Institutions can make mistakes, change strategies rapidly, or engage in short-term trading that doesn’t reflect long-term conviction. Furthermore, retail investors often act on institutional data with a lag, potentially entering trades after the primary move has occurred. Therefore, using this data as a supplementary tool rather than the primary decision-maker is essential for consistent trading success.
Frequently Asked Questions
What is the difference between FII and FPI?
FPI (Foreign Portfolio Investor) is a broader term introduced by SEBI, encompassing the erstwhile FII category and Sub-Account. FPIs are subject to the same SEBI regulations and are the entities actively trading in Indian markets.
How often is FII/DII data released?
Net FII and DII figures are typically available on a daily basis after market close from the exchanges like NSE.
Can FII/DII data predict the market with 100% accuracy?
No, FII/DII data is a significant indicator but not a foolproof predictor. Market movements are influenced by numerous factors, and institutional strategies can change.
When did FIIs and DIIs become important in India?
Their influence grew significantly after India liberalised its economy in the 1990s, with FIIs starting to invest in the early 1990s and DIIs consolidating their role over the subsequent decades.
Where can I find the latest FII/DII investment data?
You can find the latest data on the official websites of the National Stock Exchange (NSE) and Bombay Stock Exchange (BSE), as well as through reputable financial news outlets.
Do FIIs and DIIs invest only in large-cap stocks like Nifty 50?
While they are significant players in large-cap stocks and index futures/options, FIIs and DIIs also invest across various market capitalizations, including mid-cap and small-cap stocks, depending on their investment mandates.
Key Takeaways
- FIIs are foreign entities, while DIIs are domestic institutions investing in Indian markets.
- Their substantial trading volumes can significantly influence Nifty 50 prices and market sentiment.
- Consistent net buying by FIIs/DIIs often signals a bullish trend, while net selling can indicate a bearish outlook.
- DIIs often act as a stabilizing force, absorbing selling pressure from FIIs.
- Interpreting FII/DII data effectively involves tracking trends, considering context, and combining it with technical analysis.
- Relying solely on FII/DII data is risky; it should be used as a supplementary tool.
- SEBI regulations govern the activities of both FIIs and DIIs in the Indian securities market.
Investment in securities markets is subject to market risks. Read all the related documents carefully before investing.




 Finovatives