



TL;DR: Key financial ratios like the Price-to-Earnings (P/E) ratio, Earnings Per Share (EPS), and Debt-to-Equity ratio are vital tools for Indian investors to assess a company’s profitability, valuation, and financial stability, enabling more informed investment choices.
Key Stats at a Glance:
- Nifty 50 P/E Ratio (as of early 2024): Approximately 22-25, varying with market sentiment.
- Average EPS Growth for top Indian companies: Often ranges from 10-15% annually, but highly sector-dependent.
- Average Debt-to-Equity Ratio for healthy Indian businesses: Typically below 1.0, indicating lower financial risk.
- Return on Equity (ROE) benchmark in India: Often considered good if consistently above 15%.
- Market Capitalisation of BSE and NSE combined: Exceeds ₹300 trillion.
What are Financial Ratios and Why Do They Matter for Indian Investors?
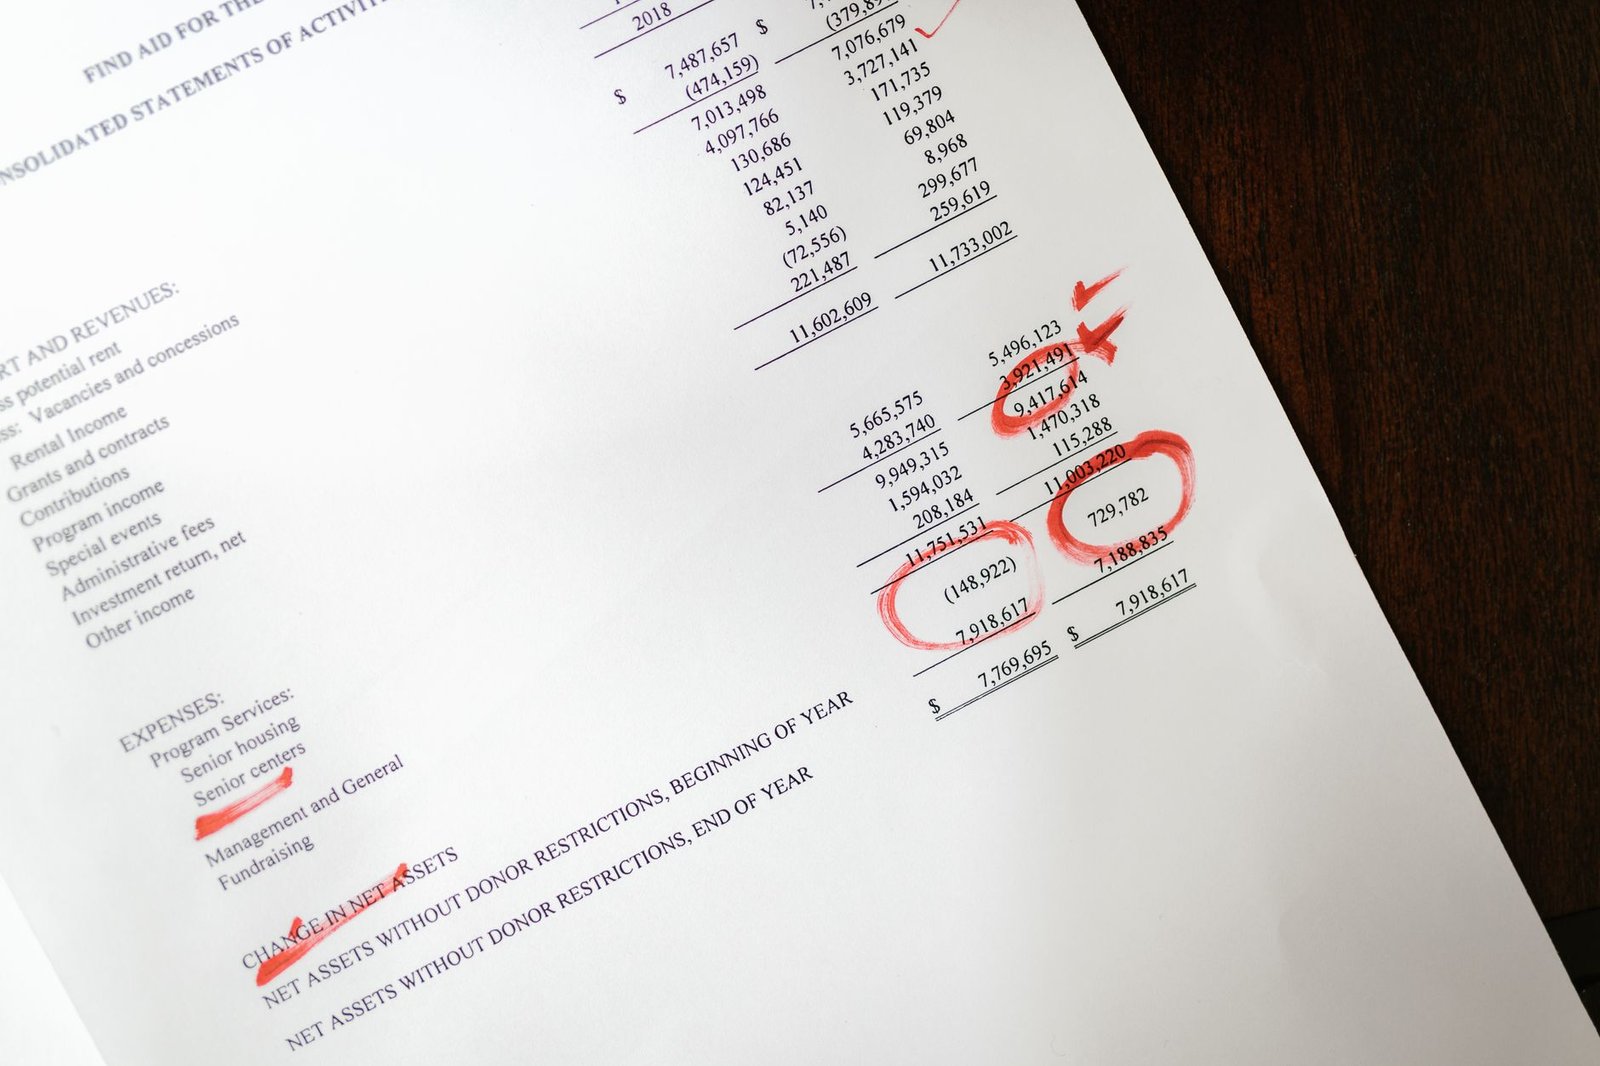
Financial ratios are calculations that help investors and analysts understand a company’s performance and financial health by comparing different line items from its financial statements, primarily the balance sheet, income statement, and cash flow statement.
For Indian investors navigating the dynamic landscape of the NSE and BSE, these ratios are indispensable because they provide a standardized way to compare companies within the same industry, identify trends over time, and gauge the intrinsic value of a stock, moving beyond just headline-grabbing news or speculation.

Can You Explain the Most Important Financial Ratios for Indian Stocks?
Yes, several core financial ratios are fundamental for any Indian investor looking to make sound investment decisions.
Price-to-Earnings (P/E) Ratio
The P/E ratio is perhaps the most widely used valuation metric. It tells you how much investors are willing to pay for each rupee of a company’s earnings. A high P/E might suggest that investors expect higher future earnings growth, while a low P/E could indicate the stock is undervalued or facing issues.
How to Calculate P/E Ratio
P/E Ratio = Market Price Per Share / Earnings Per Share (EPS)
Earnings Per Share (EPS)
EPS is a company’s net profit divided by the number of outstanding shares. It represents the portion of a company’s profit allocated to each outstanding share of common stock. Growing EPS is generally a positive sign for investors.
How to Calculate EPS
EPS = (Net Income - Preferred Dividends) / Average Outstanding Common Shares
Debt-to-Equity (D/E) Ratio
This ratio measures a company’s financial leverage. It compares a company’s total liabilities to its shareholder equity. A high D/E ratio indicates that a company is using a significant amount of debt to finance its assets, which can increase financial risk, especially during economic downturns.
How to Calculate D/E Ratio
Debt-to-Equity Ratio = Total Liabilities / Total Shareholder Equity
Return on Equity (ROE)
ROE measures a company’s profitability by revealing how much profit a company generates with the money shareholders have invested. A higher ROE generally indicates better profitability and efficient use of shareholder funds.
How to Calculate ROE
ROE = Net Income / Average Shareholder Equity
Current Ratio
The current ratio is a liquidity ratio that measures a company’s ability to pay off its short-term liabilities (due within one year) with its short-term assets. A ratio above 1 is generally preferred, indicating the company has more current assets than current liabilities.
How to Calculate Current Ratio
Current Ratio = Current Assets / Current Liabilities
How Can I Use These Ratios to Analyse an Indian Company?
Using financial ratios effectively involves more than just calculating them; it requires context and comparison to derive meaningful insights.
1. Compare with Industry Averages
No single ratio tells the whole story. A P/E of 30 might be high for a mature utility company but reasonable for a fast-growing tech firm. Always compare a company’s ratios against the average ratios of its peers in the same industry. SEBI guidelines often lead to industry-specific reporting standards that aid this comparison.
2. Analyse Trends Over Time
Look at how a company’s ratios have changed over the past 3-5 years. Is its debt-to-equity ratio increasing or decreasing? Is its ROE improving? Consistent improvement in key ratios suggests a well-managed and growing business.
3. Understand the Business Model
Ratios should be viewed in light of the company’s business model and industry dynamics. For example, capital-intensive industries might naturally have higher debt levels.
4. Use a Combination of Ratios
Don’t rely on a single ratio. A company might have a low P/E but a high debt burden, or a high ROE but stagnant EPS growth. A holistic view using a basket of ratios provides a more robust assessment.
5. Check the Source and Quality of Earnings
Ensure the financial statements are audited and from reliable sources like NSE or BSE filings. Understand how earnings are generated – are they sustainable, or due to one-off events?
How to Start Analysing Stocks Using Financial Ratios
Embarking on stock analysis using financial ratios can seem daunting, but a structured approach makes it manageable for any Indian investor.
- Identify Your Investment Goal: Determine if you’re looking for growth, value, or income, as this will guide which ratios are most important.
- Select Stocks to Research: Start with companies you are familiar with or those that operate in sectors you understand. You can find lists on the NSE and BSE websites.
- Obtain Financial Statements: Download the latest annual reports (Balance Sheet, Income Statement, Cash Flow Statement) from the company’s investor relations page or the exchange websites.
- Calculate Key Ratios: Use the formulas mentioned above to calculate P/E, EPS, D/E, ROE, and Current Ratio for the last 3-5 years. Many financial portals provide these ratios pre-calculated.
- Compare with Industry Peers: Research the average ratios for the industry the company operates in. Financial websites and brokerage reports often have this data.
- Analyse Trends: Plot the calculated ratios over the years to visualize performance trends. Look for consistency and improvement.
- Read Management Commentary: Pay attention to the ‘Management Discussion and Analysis’ section in the annual report for qualitative insights into the company’s performance and future outlook.
- Consult Reliable Tools: Consider using advanced tools, like a comprehensive TradingView indicator, that can automate ratio calculations and comparisons, saving you significant time. For instance, our Trend Traders Tool can streamline this process.

Frequently Asked Questions
What is the ideal P/E ratio for Indian stocks?
There isn’t a single ‘ideal’ P/E ratio. It varies significantly by industry, market conditions, and growth prospects. Generally, a P/E between 15-25 is common for mature companies, but growth stocks might justify higher multiples.
Is a high Debt-to-Equity ratio always bad?
Not necessarily. While a high D/E ratio increases risk, it can be acceptable in capital-intensive industries like utilities or infrastructure where high debt is standard. However, it warrants careful scrutiny.
How often should I check financial ratios?
For active investors, checking key ratios quarterly after financial results are announced is advisable. For long-term investors, an annual review of updated ratios alongside the annual report is generally sufficient.
What’s the difference between EPS and Diluted EPS?
Basic EPS uses the current outstanding shares. Diluted EPS considers the effect of all potential stock issuances (like stock options or convertible bonds), providing a more conservative view of earnings per share.
Can financial ratios predict stock prices?
Financial ratios are indicators of a company’s fundamental health and valuation, not direct predictors of short-term stock price movements. They help in identifying potentially undervalued or overvalued stocks for long-term investment.
Which is more important, ROE or ROA?
Both are important. ROE (Return on Equity) shows profitability relative to shareholder investment, while ROA (Return on Assets) shows profitability relative to total assets. ROE is often more relevant for shareholders, but ROA provides insight into asset efficiency.
Key Takeaways:
- Financial ratios are essential tools for analysing the health and valuation of Indian companies listed on NSE and BSE.
- Key ratios like P/E, EPS, D/E, ROE, and Current Ratio offer insights into profitability, growth, leverage, and liquidity.
- Always compare a company’s ratios against industry averages and analyse trends over several periods.
- Understand the company’s business model and industry context when interpreting financial ratios.
- A combination of ratios provides a more comprehensive picture than relying on a single metric.
- Utilising financial data from official sources like SEBI, NSE, and BSE filings is crucial for accuracy.
- Consistent monitoring and analysis using these ratios can lead to more informed and potentially profitable investment decisions.
Disclaimer: Investing in the stock market involves risks. Please consult with a qualified financial advisor before making any investment decisions.






 Finovatives