TL;DR: Volume analysis helps traders decipher the true market sentiment by tracking the number of shares traded, revealing ‘smart money’ activity and potential price reversals or continuations on the NSE.
Key Stats at a Glance:
- NSE Average Daily Turnover (FY23): ₹1.2 Lakh Crore+
- Nifty 50’s 10-year CAGR: ~12.4% (as of early 2024)
- Average Daily Volume on NSE (Equities): 100 Crore+ shares
- SEBI mandate on T+1 settlement for all trades
- Over 4,000 actively traded stocks on NSE
Understanding Volume Analysis in the Indian Market
Volume analysis is a powerful technique that examines the number of shares traded during a specific period to gauge market interest and the strength behind price movements on the NSE.
What is Trading Volume?
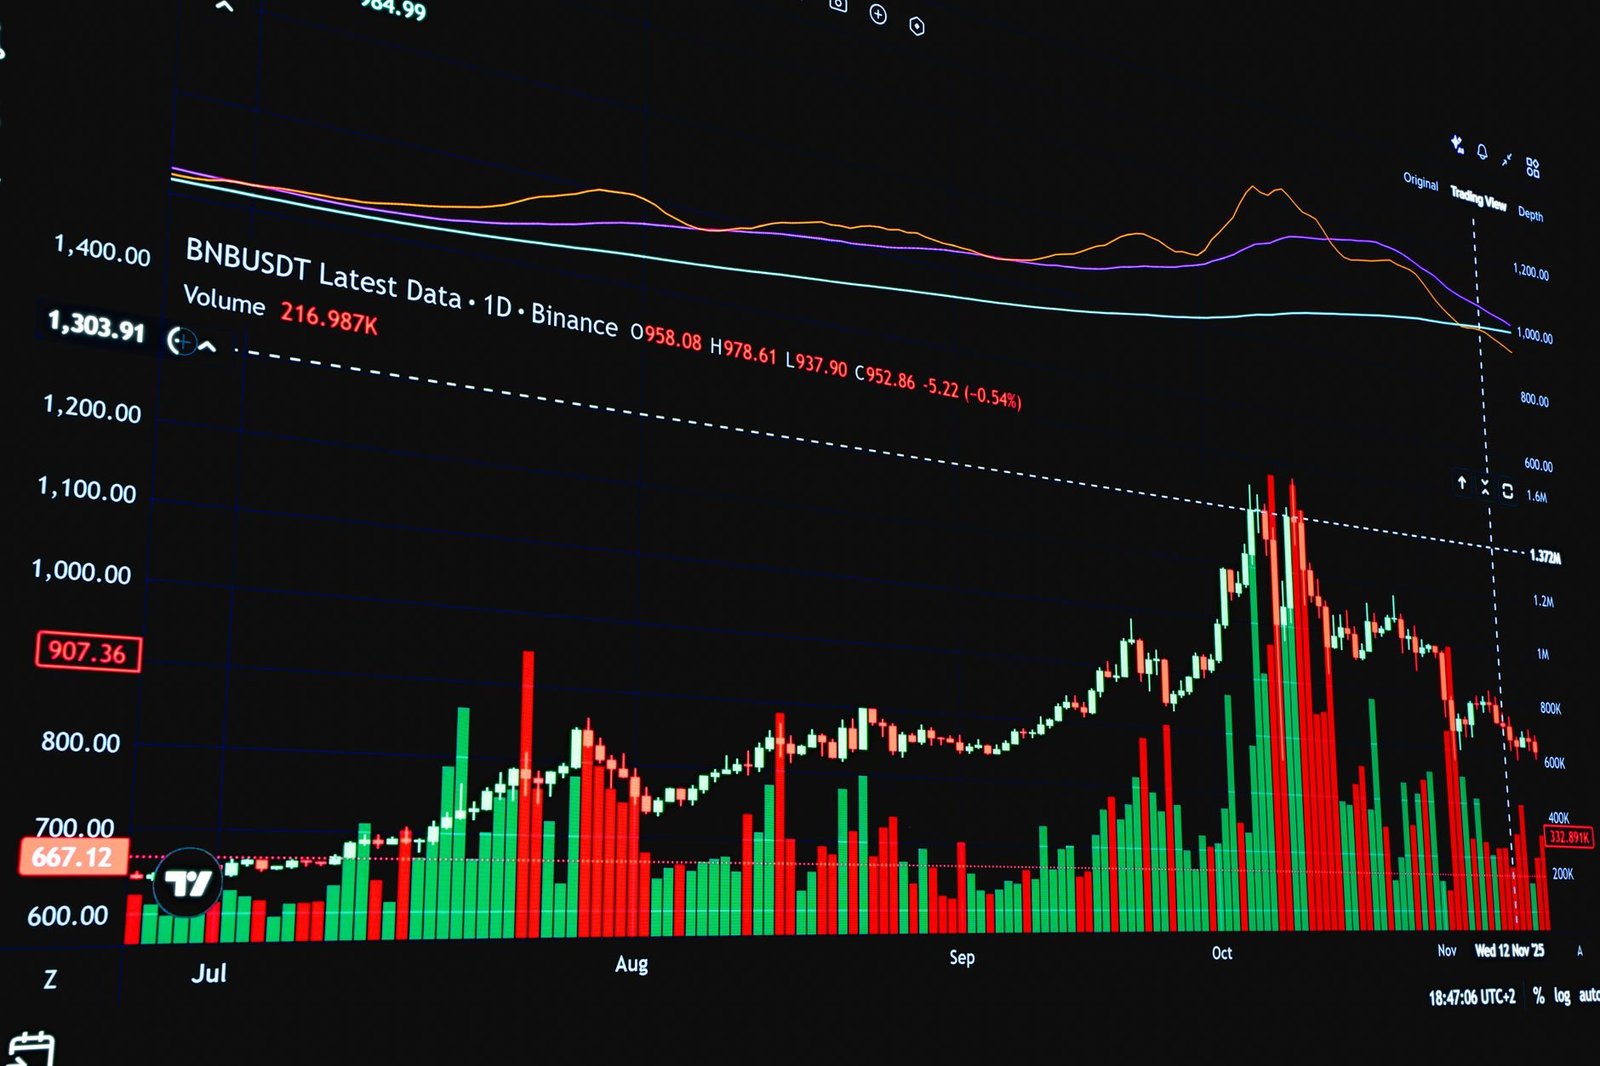
Trading volume simply refers to the total number of shares or contracts exchanged between buyers and sellers for a particular security during a trading session. It’s a key indicator of market participation and conviction. Higher volume generally signifies greater interest and stronger commitment from market participants, while lower volume suggests a lack of conviction or interest.
Why is Volume Analysis Crucial for NSE Traders?
For Indian traders navigating the dynamic NSE, understanding volume is paramount. It acts as a confirmation tool for price action, helps identify potential trend reversals, and can even signal the presence of institutional investors, often referred to as ‘smart money’. Without considering volume, price charts alone can be misleading. For instance, a sharp price rise on extremely low volume might be less significant than a modest rise on exceptionally high volume.
Smart money, comprising institutional investors like mutual funds, FIIs, DIIs, and large proprietary trading desks, often has the capital to move markets. By analysing volume patterns, retail traders can attempt to infer their actions and align their strategies accordingly. This is where tools and indicators that focus on volume can be particularly advantageous.
Decoding Smart Money Activity with Volume
Smart money activity is often characterized by large order sizes and sustained participation, which translate into noticeable volume patterns on trading charts.
Identifying Accumulation and Distribution
Accumulation occurs when smart money is quietly buying a stock, often absorbing selling pressure without causing a drastic price increase. This is typically seen as rising volume on up days and declining volume on down days, with the price potentially trading in a tight range or showing a gradual upward bias. Distribution, conversely, is when smart money is selling its holdings. This can manifest as high volume on down days, suggesting aggressive selling, or a lack of buying interest even as the price attempts to rise, coupled with low volume on up days.
Volume Spikes and Their Significance
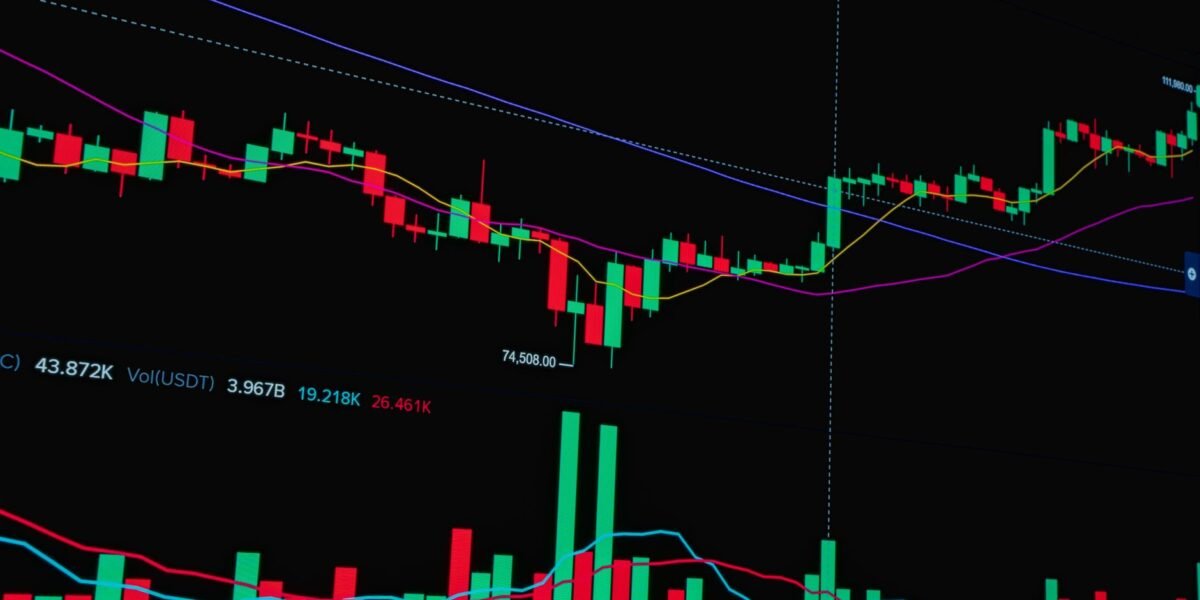
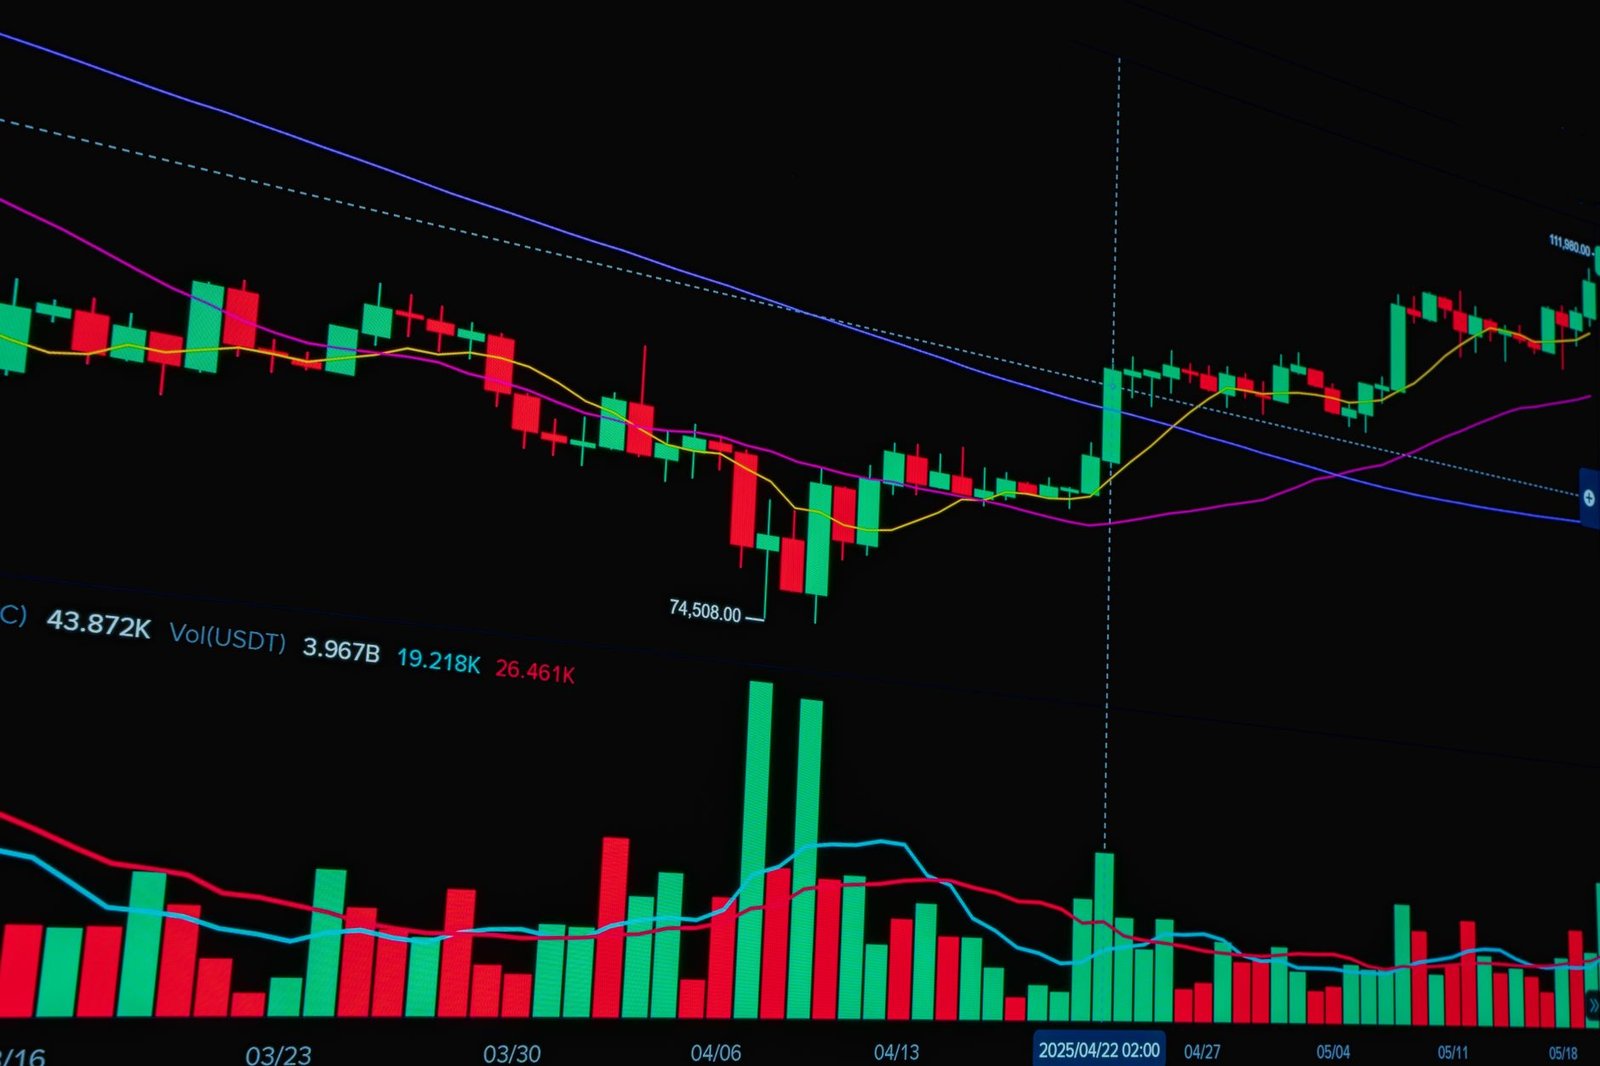
Sudden, sharp increases in trading volume, known as volume spikes, often accompany significant market events or news. These spikes, especially when aligned with substantial price movements, can indicate strong conviction from market participants. A spike on a breakout above a resistance level, for instance, suggests that the breakout is robust and likely to continue. Conversely, a volume spike accompanying a breakdown below support might signal a significant bearish move.
Volume Confirmation of Price Trends
Volume analysis is most effective when used to confirm price action. During an uptrend, volume should ideally increase as prices rise and decrease as prices pull back. This pattern indicates healthy buying pressure. In a downtrend, volume should increase on down moves and decrease on upswings, confirming the selling pressure. If price and volume diverge – for example, if prices are making new highs but volume is declining – it can be a warning sign of a weakening trend.
Key Volume Indicators for NSE Traders
Several technical indicators are built upon volume data, providing deeper insights into market dynamics and helping traders interpret smart money’s intentions.
On-Balance Volume (OBV)
OBV is a momentum indicator that relates volume to price change. It adds the volume of an up period to the running total and subtracts the volume of a down period. A rising OBV suggests that volume is heavier on up days than on down days, indicating buying pressure. A falling OBV suggests the opposite. Divergences between OBV and price are often considered significant signals.
Volume Profile
Volume Profile goes beyond the simple volume bars seen on most charts. It displays trading activity (volume) at specific price levels over a given period. Key areas where significant volume has traded are highlighted as ‘High Volume Nodes’ (HVNs), which often act as support or resistance. ‘Low Volume Nodes’ (LVNs) indicate price levels where little trading occurred, suggesting potential fast price movement through them. This provides a more granular view of where the ‘battle’ between buyers and sellers has been most intense.
Chaikin Money Flow (CMF)
Developed by Marc Chaikin, CMF measures the amount of money flow volume over a specific period. It assesses whether smart money is accumulating or distributing by looking at the relationship between the closing price relative to the period’s high-low range and the volume. A positive CMF suggests accumulation, while a negative CMF indicates distribution.
How to Use Volume Analysis in Your Trading Strategy
Integrating volume analysis into your trading approach can significantly enhance your decision-making process. It requires observation, practice, and a systematic approach.
- Start with Basic Volume Bars: Begin by observing the volume bars on your trading charts. Note the volume during significant price moves, breakouts, and reversals. Look for confirmation: does volume increase with the move you expect?
- Identify Trend Strength: Analyse volume patterns to confirm the strength of existing trends. In uptrends, watch for increasing volume on upswings and decreasing volume on pullbacks. In downtrends, expect increasing volume on downswings and decreasing volume on rallies.
- Spot Potential Reversals: Look for divergences between price action and volume. For example, if the Nifty 50 is making new highs but the volume is declining, it could signal a potential reversal. Conversely, high volume on a potential bottoming pattern might suggest accumulation.
- Confirm Breakouts and Breakdowns: When a stock or index breaks through a key resistance or support level, check the volume. A breakout on significantly higher-than-average volume is more likely to be successful and sustainable. A breakdown on high volume suggests strong selling pressure.
- Utilize Volume Indicators: Experiment with indicators like OBV and CMF. Learn to interpret their signals, especially divergences with price, as potential leading indicators of market shifts.
- Incorporate Volume Profile: If your charting platform offers Volume Profile, use it to identify key support and resistance areas based on where most of the trading activity has occurred. High Volume Nodes often act as magnets or barriers for price.
- Backtest and Refine: Before trading live, backtest your volume analysis strategies on historical data. Use tools like our TradingView indicator to simulate trades and refine your entry and exit points based on volume confirmation. Consider a free trial to explore its capabilities.

Common Mistakes to Avoid in Volume Analysis
While powerful, volume analysis is not foolproof and can be misinterpreted if not applied correctly.
Ignoring Context
Volume must always be analysed within the broader market context. A high volume spike might be significant during a trending period but less so during a period of low overall market activity or a specific news event that temporarily inflates trading. Always compare current volume to historical averages.
Over-reliance on Single Indicators
No single indicator, including volume-based ones, should be used in isolation. Relying solely on OBV or CMF without considering price action, chart patterns, or other confirming indicators can lead to false signals. A holistic approach is essential.
Misinterpreting Low Volume
Low volume doesn’t always mean a lack of interest or a weak move. It could indicate a lack of sellers in a strong uptrend, or a lack of buyers in a strong downtrend, showing conviction in the current direction. It’s the *relationship* between price and volume, and volume’s behaviour during specific price actions, that matters most.
Forgetting About Futures and Options Volume
While this guide focuses on equity volume, for more advanced analysis, especially in indices like Nifty and Bank Nifty, understanding the volume in their derivatives (futures and options) can provide additional insights into smart money positioning and sentiment.
Frequently Asked Questions
What is the most important aspect of volume analysis?
The most important aspect is using volume to confirm price action and identify the conviction behind market moves, helping distinguish between genuine trends and potential fakes.
Can volume analysis predict the future?
Volume analysis does not predict the future with certainty but provides probabilistic insights into potential price movements by revealing current market sentiment and smart money activity.
How does volume analysis help identify ‘smart money’?
It helps by showing patterns of sustained buying (accumulation) or selling (distribution) with significant volume, which are characteristic of large institutional players.
Is volume analysis useful for intraday trading?
Yes, volume analysis is extremely useful for intraday traders to gauge momentum, confirm intraday breakouts, and identify potential reversals during the trading session.
When should I consider a volume spike significant?
A volume spike is generally considered significant when it accompanies a notable price move (breakout, breakdown, or reversal) and is substantially higher than average volume for that security or index.
How does the T+1 settlement impact volume analysis?
The T+1 settlement means trades are settled the next day, which can slightly alter the immediacy of volume impact compared to T+2, but the core principles of volume analysis remain unchanged.
Key Takeaways
- Volume analysis provides critical context to price movements on the NSE, helping traders understand market sentiment.
- Observing volume spikes, accumulation/distribution patterns, and trend confirmation strengthens trading decisions.
- Key volume indicators like OBV, Volume Profile, and CMF offer deeper insights into smart money activity.
- Always use volume analysis in conjunction with other technical tools and consider the broader market context.
- Avoid common pitfalls such as ignoring context or over-relying on single indicators.
- Understanding derivatives volume can add another layer to advanced analysis for indices.
Trading in the securities market is subject to market risks. Please read all the related documents carefully before investing.




 Finovatives