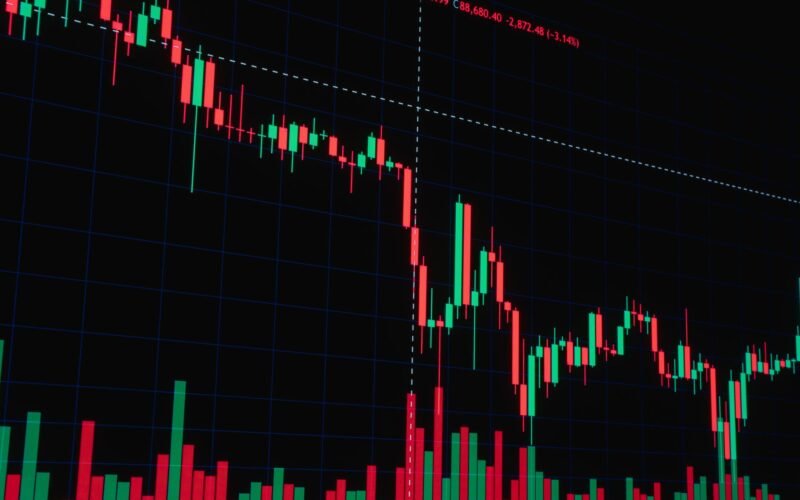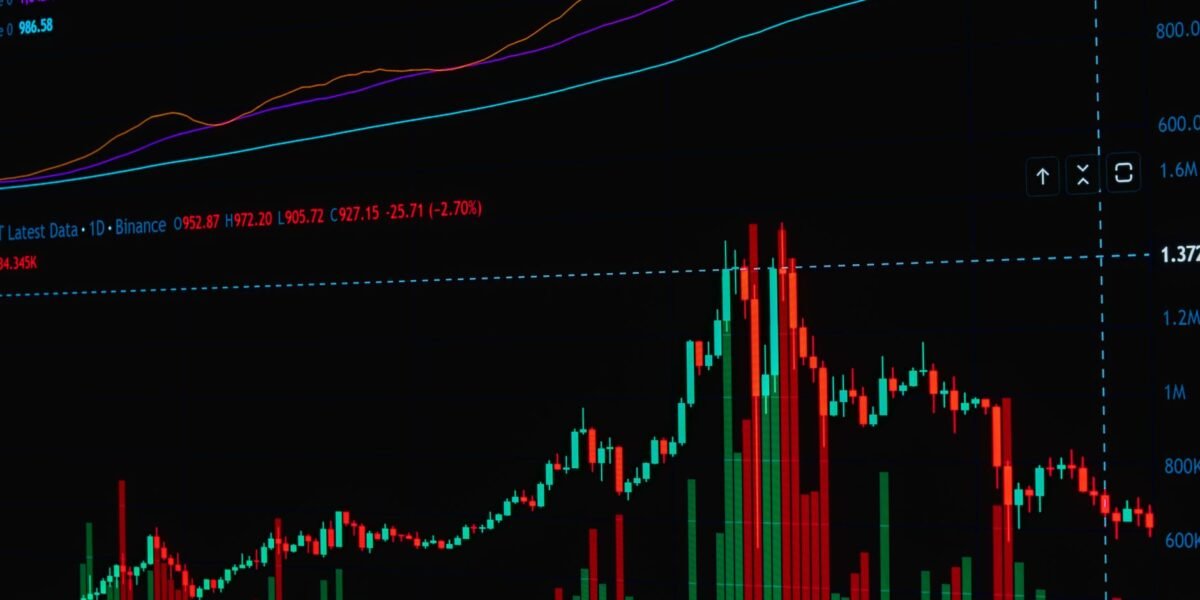
TL;DR: Volume analysis on the NSE helps you decipher ‘smart money’ activity by tracking the intensity of buying and selling pressure, allowing retail traders to identify potential market reversals or continuations often missed by price action alone.
Key Stats at a Glance:
- NSE daily average trading volume: Over ₹1 Lakh Crore (as of recent periods).
- S&P BSE Sensex: 30-stock index, representing ~50% of India’s market cap.
- Nifty 50: 50-stock index, often used as a benchmark for Indian equity market performance.
- Number of listed companies on NSE: Over 4,000.
- Typical volume spikes: Often precede significant price moves by 1-3 trading sessions.
What is Volume Analysis in Stock Trading?
Volume analysis is the study of trading volume – the number of shares or contracts traded over a specific period – to gauge the strength and conviction behind price movements.
Understanding Smart Money and Volume
Smart money refers to the trading activity of large, informed institutional investors like mutual funds, hedge funds, and proprietary trading desks, whose actions can significantly influence market direction.
The Role of Institutions in the Market
Institutions often have access to better research, more capital, and a longer-term perspective, making their buying and selling decisions crucial indicators of future price action. Their large orders can create distinct volume patterns.
Volume as a Confirmation Tool
High volume accompanying a price move suggests strong conviction from market participants, while low volume indicates a lack of commitment, potentially signaling a false breakout or a weak trend.
How Does Volume Analysis Work on the NSE?
Volume analysis on the NSE involves examining trading volume data alongside price action to confirm trends, identify potential reversals, and gauge the strength of market moves.
Interpreting Volume Bars
Each volume bar on a trading chart represents the total volume traded during that specific time interval (e.g., a day, an hour, or 15 minutes), showing the intensity of trading activity.
Price and Volume Relationship
The interplay between price changes and volume is key: rising prices on high volume suggest bullish strength, while falling prices on high volume indicate bearish pressure. Conversely, price moves on low volume are often less reliable.
Key Concepts in Volume Analysis
Volume Spikes
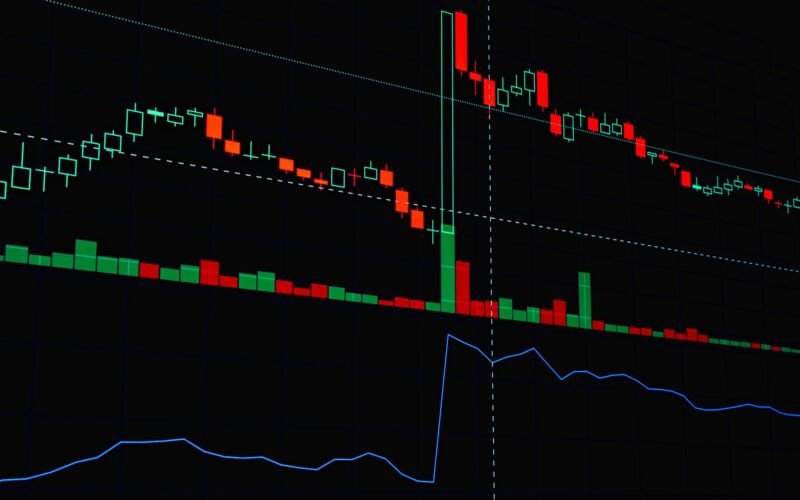
A sudden, significant increase in trading volume, often called a volume spike, can signal increased institutional interest or a major event impacting a stock or the broader market.
Volume at Support and Resistance
Observing volume as prices approach key support or resistance levels can reveal whether institutions are defending these levels or preparing to break through them.
Accumulation vs. Distribution
Accumulation is characterized by rising prices with increasing volume, suggesting smart money is buying, while distribution sees falling prices on rising volume, indicating smart money is selling.
How to Use Volume Analysis in Your Trading Strategy:
- Choose Your Timeframe: Select a trading chart timeframe (e.g., daily, hourly) that aligns with your trading style.
- Add Volume Indicator: Most charting platforms, including TradingView, offer a built-in volume indicator. Add it to your chart.
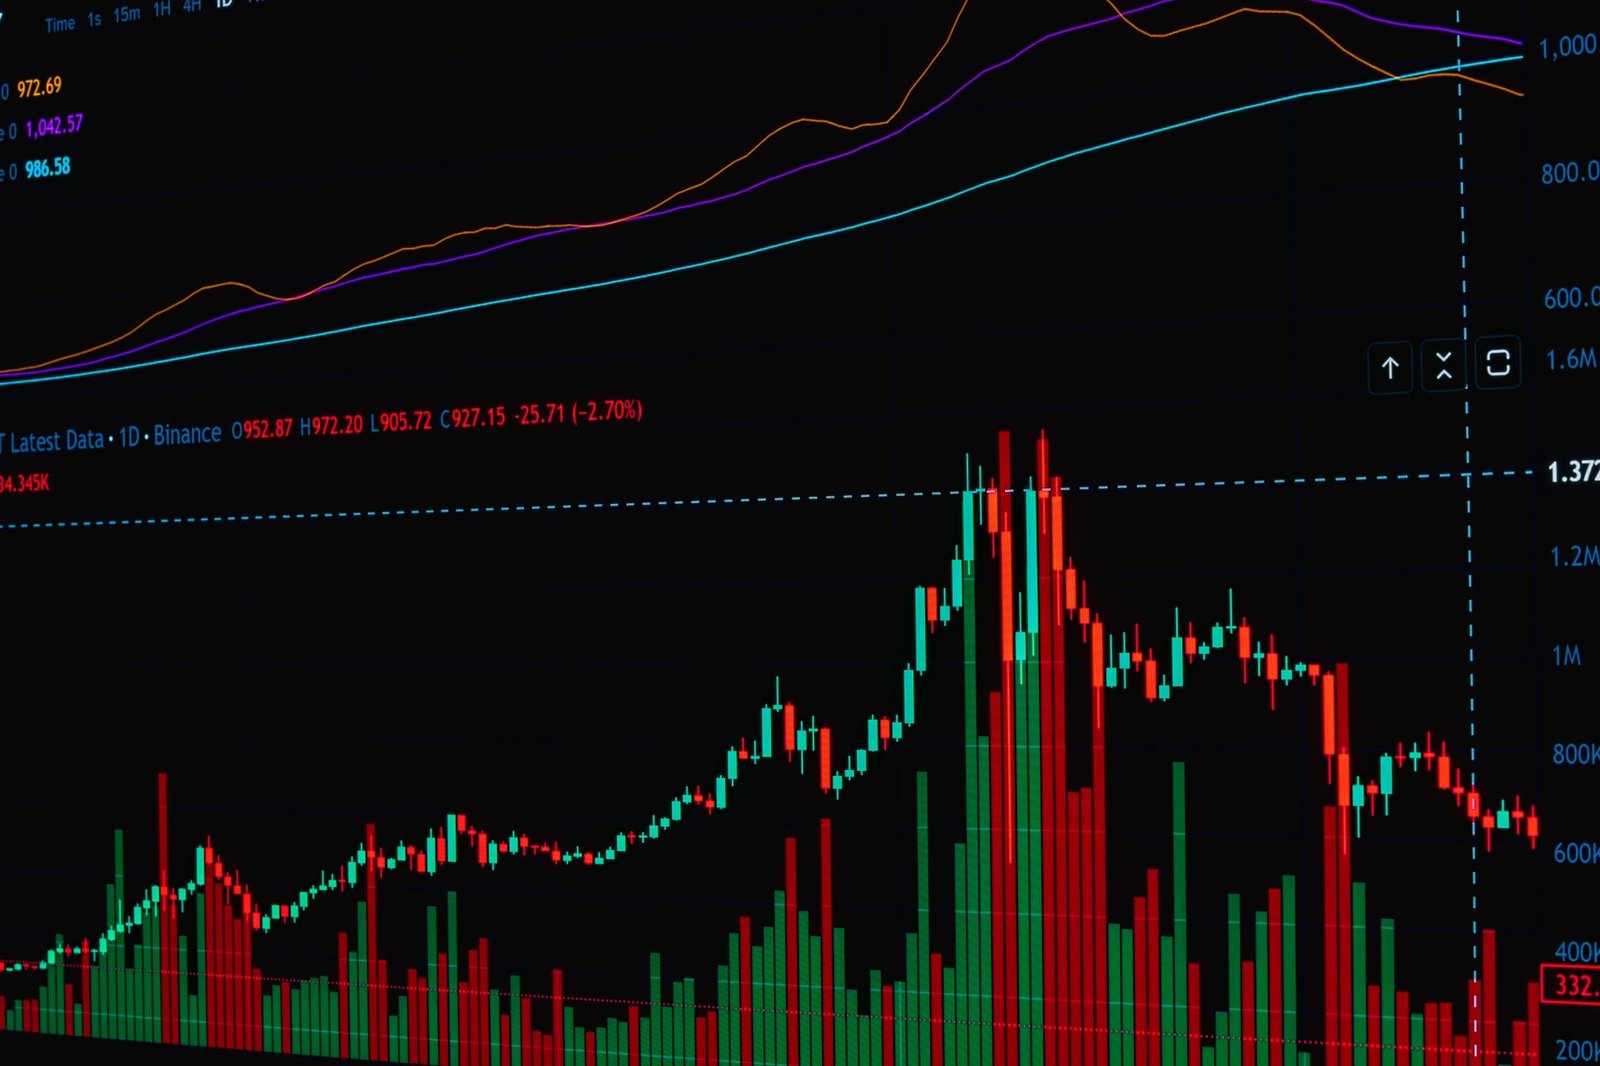
- Observe Price and Volume Correlation: Watch how price moves correlate with the volume bars. Look for confirming signals: rising price with rising volume, or falling price with rising volume.
- Identify Volume Spikes: Pay close attention to unusually high volume bars. These often occur at critical price levels or during significant news events.
- Analyse Volume at Key Levels: When price approaches support or resistance, check if volume increases. High volume on a breakout attempt confirms strength; high volume rejection suggests the level may hold.
- Look for Accumulation/Distribution Patterns: Spot periods where prices consolidate with increasing volume on upsways (accumulation) or downsways (distribution).
- Combine with Other Indicators: Use volume analysis in conjunction with other technical indicators (like moving averages or RSI) for stronger trading signals.
- Backtest Your Strategy: Before trading with real money, backtest your volume-based trading rules on historical data to assess their effectiveness.
Volume Patterns Indicating Smart Money Moves
Bullish Divergence with Volume
When the price makes a lower low but the volume on the subsequent upswing is significantly higher than on the downswing, it can suggest accumulation and potential reversal.
Bearish Divergence with Volume
Conversely, if the price makes a higher high on decreasing volume, followed by a reversal on high volume, it may signal distribution and a potential top.
Breakouts with High Volume
A breakout above resistance or below support on significantly higher-than-average volume is a strong indication that smart money is participating and the move is likely to continue.
Climactic Volume
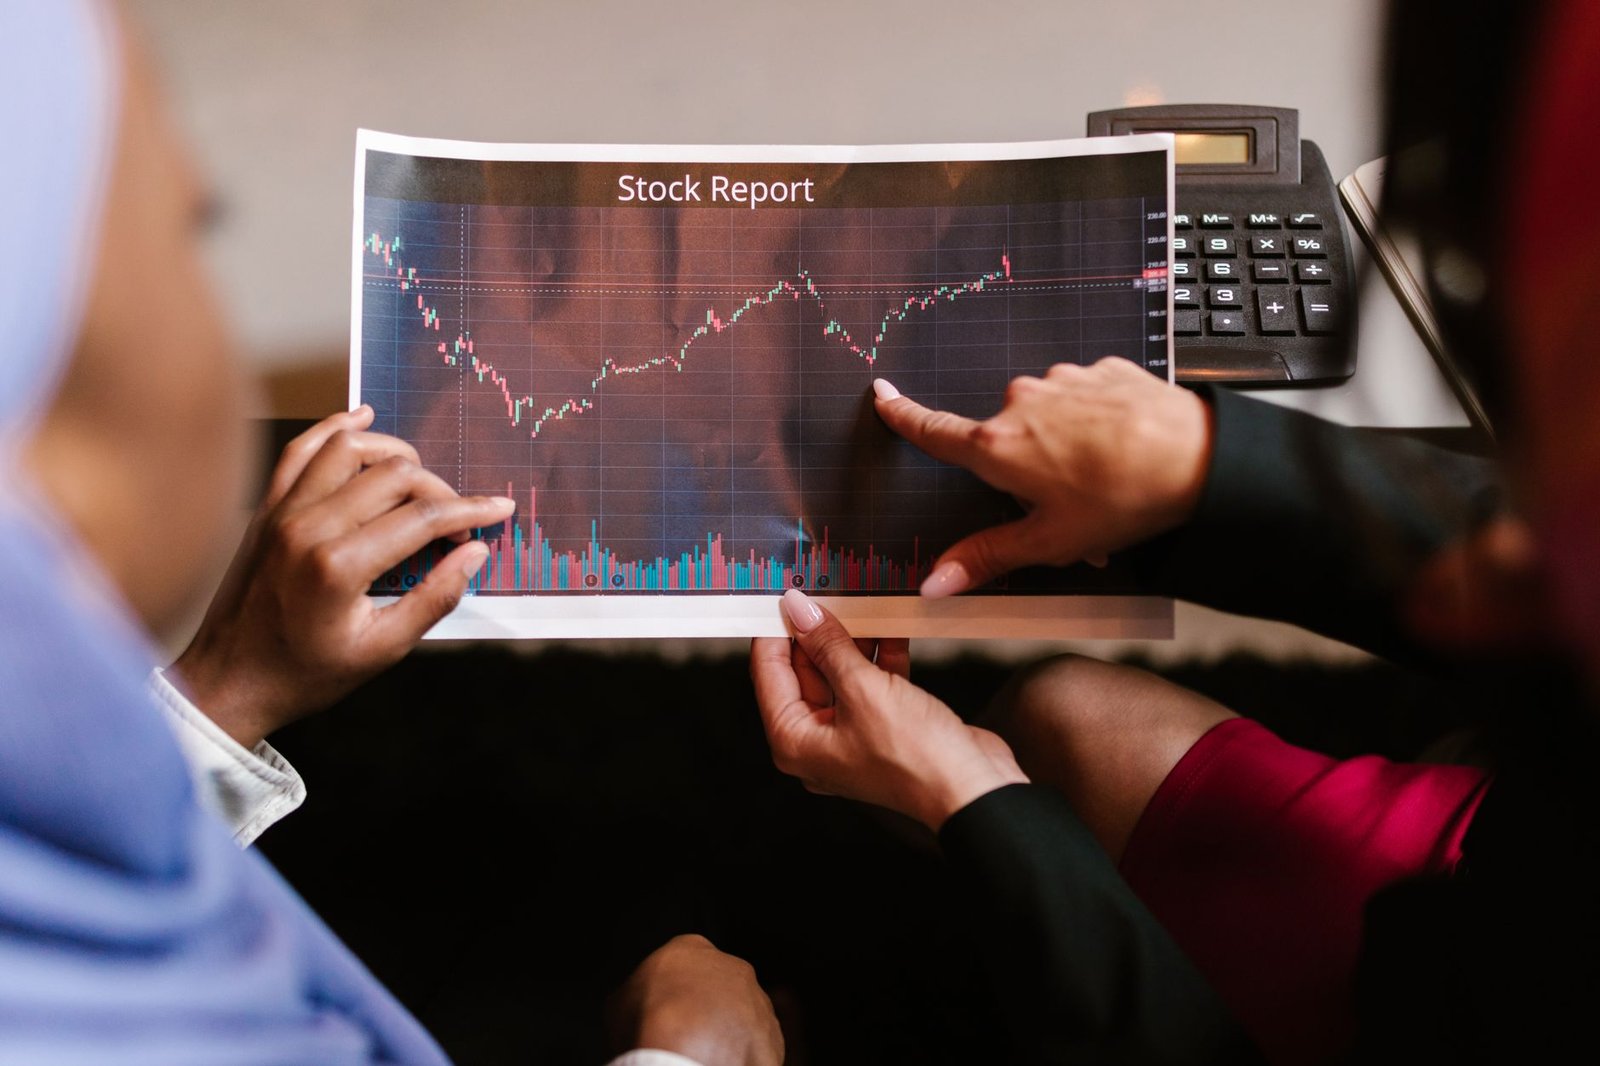
A climactic volume surge, often seen at the end of a prolonged trend, can indicate a final wave of panic buying (a top) or panic selling (a bottom), potentially leading to a reversal.
Volume Analysis Across Different Markets on NSE
Equities
In the equity market, volume analysis helps identify institutional interest in specific stocks, confirming uptrends or signalling potential downtrends before they become obvious in price alone.
Futures and Options
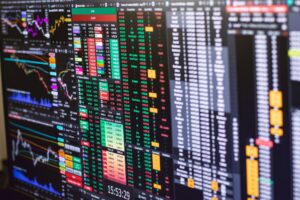
For F&O traders, volume in the derivatives segment can provide insights into the positioning of large players, indicating bullish or bearish sentiment for underlying assets. A spike in futures volume, for instance, can foreshadow a significant move in the spot market.
[IMAGE_PLACE_HOLDER_3]
Commodities (MCX)
On commodity exchanges like MCX, volume analysis is critical for understanding the demand and supply dynamics of precious metals, energy, and agricultural products, revealing the conviction behind price trends.
Limitations of Volume Analysis
While powerful, volume analysis isn’t foolproof. Factors like block deals, off-market transactions, or high-frequency trading algorithms can sometimes distort volume signals, making interpretation challenging.
The Importance of Context
Volume data should always be interpreted within the broader market context, considering overall economic conditions, news events, and the specific industry sector of the asset being traded.
Frequently Asked Questions
What is the most important aspect of volume analysis?
The most crucial aspect is the relationship between price and volume – how volume confirms or contradicts price action, signalling conviction or lack thereof.
Can volume analysis predict exact price targets?
No, volume analysis doesn’t predict exact price targets but helps assess the probability of a price move continuing or reversing, improving trade timing.
How does smart money use volume?
Smart money uses volume to enter and exit large positions without drastically moving the price initially, and retail traders observe these volume patterns to infer their activity.
Is volume analysis effective for intraday trading?
Yes, volume analysis is highly effective for intraday trading as it provides real-time confirmation of buying and selling pressure during short trading sessions.
What is a typical volume spike on NSE?
A volume spike is generally considered significant if it’s 2-3 times (or more) the average daily volume for that particular stock or index.

How can I access volume data for NSE stocks?
Volume data is readily available on most financial websites and charting platforms, including TradingView, which integrates seamlessly with Finovatives.com’s tools, and directly from NSE India’s official website.
Key Takeaways
- Volume analysis reveals the ‘smart money’ behind price movements by tracking trading intensity.
- Look for high volume to confirm significant price moves and breakouts.
- Low volume on a price move suggests weakness and a potential reversal.
- Volume spikes can indicate increased institutional interest or pivotal market moments.
- Accumulation (buying) and distribution (selling) patterns are identifiable through volume trends.
- Always use volume analysis in conjunction with price action and other indicators.
- Context is key; consider market conditions and news when interpreting volume.
Disclaimer: Investing in the stock market involves inherent risks. All trading decisions should be made after thorough research and consideration of your risk tolerance.


 Finovatives