

TL;DR: Support and resistance levels are crucial price points in stock trading where the market’s buying or selling pressure is expected to stall or reverse a trend, acting as critical decision-making zones for traders.
Key Stats at a Glance:
- Nifty 50’s historical tendency to find support/resistance around psychological round numbers (e.g., 1000, 5000, 10000, 15000, 20000 points).
- The average number of times a support or resistance level is tested before breaking can vary significantly, but often ranges from 3-7 times in stable markets.
- Over 75% of traders reportedly use support and resistance levels in their daily trading analysis.
- Major Indian stock indices like Nifty 50 and Sensex often exhibit clear support and resistance formations.
- The BSE Sensex has seen its historical peaks and troughs frequently align with established support and resistance zones.
What is Support and Resistance?
Support and resistance are price levels on a stock chart where a security’s price has historically had trouble breaking through. Support is a price level where demand is strong enough to prevent a price from falling further, while resistance is a price level where selling pressure is strong enough to prevent a price from rising further.
How Do Support and Resistance Levels Work?
These levels work because they represent areas where a significant number of traders have made similar decisions in the past, creating psychological barriers and self-fulfilling prophecies. At support, buyers, seeing a bargain, step in. At resistance, sellers, seeing an overvalued price, emerge. These collective actions create zones where price may pause or reverse.
Why Are Support and Resistance Important for Traders?
Support and resistance levels are vital for traders as they help in identifying potential entry and exit points, setting stop-loss orders, and managing risk. They provide a framework for understanding market sentiment and anticipating potential price movements, thereby forming the backbone of many trading strategies on platforms like TradingView.
Identifying Support Levels
Support levels are typically identified by looking at past price lows. When a stock price falls and then bounces back from a certain level multiple times, that level can be considered a support. Historical price charts are the primary tool for this identification, with traders often marking these points visually.
Identifying Resistance Levels
Resistance levels are identified by examining past price highs. When a stock price rises and then falls back from a particular level repeatedly, that level acts as resistance. Similar to support, historical price action on charts is key to pinpointing these zones.
The Psychology Behind Support and Resistance
The psychology is rooted in human behaviour and memory. Traders remember previous price points where significant buying or selling occurred. When the price approaches these remembered levels, the same emotions – fear of missing out (FOMO) at support or fear of losing profits at resistance – can drive similar trading decisions, reinforcing the levels.
How to Use Support and Resistance in Trading
Traders use these levels to make informed decisions. Buying near support and selling near resistance is a common strategy. Furthermore, these levels are critical for setting stop-loss orders to limit potential losses if the price moves against the trader’s position. The confirmation of a break or a bounce at these levels often signals the next directional move.
How to Implement Support and Resistance Trading Strategies:
- Identify Key Levels: Analyse historical price charts (daily, weekly) to locate significant price points where the stock has reversed multiple times. Use tools like horizontal lines on your charting platform.
- Observe Price Action at Levels: Wait for the price to approach a support or resistance level. Do not anticipate; observe how the price reacts. Look for confirmation signals like candlestick patterns (e.g., hammer at support, shooting star at resistance).
- Determine Entry/Exit Points: If the price bounces off support, consider a long entry. If it breaks below support, it may signal a bearish move, and a short entry could be considered. Conversely, a bounce off resistance suggests a short entry, while a break above resistance signals a bullish move, potentially for a long entry.
- Set Stop-Loss Orders: For a long position initiated near support, place the stop-loss slightly below the support level. For a short position initiated near resistance, place the stop-loss slightly above the resistance level.
- Manage Profit Targets: Set profit targets based on subsequent resistance levels (for long trades) or support levels (for short trades). Alternatively, use a trailing stop-loss to capture larger moves.
- Understand Breakouts and Breakdowns: Be aware that levels can break. A breakout above resistance or a breakdown below support can signal a strong trend continuation. Trade these breakouts cautiously, looking for confirmation.
- Consider Volume: High trading volume accompanying a price move through a support or resistance level adds conviction to the breakout or breakdown.

Types of Support and Resistance Levels
Support and resistance aren’t just single lines; they can manifest in various forms. Understanding these different types helps traders refine their analysis and strategies. These can be identified visually on charts and are fundamental for any technical analysis.
Horizontal Support and Resistance
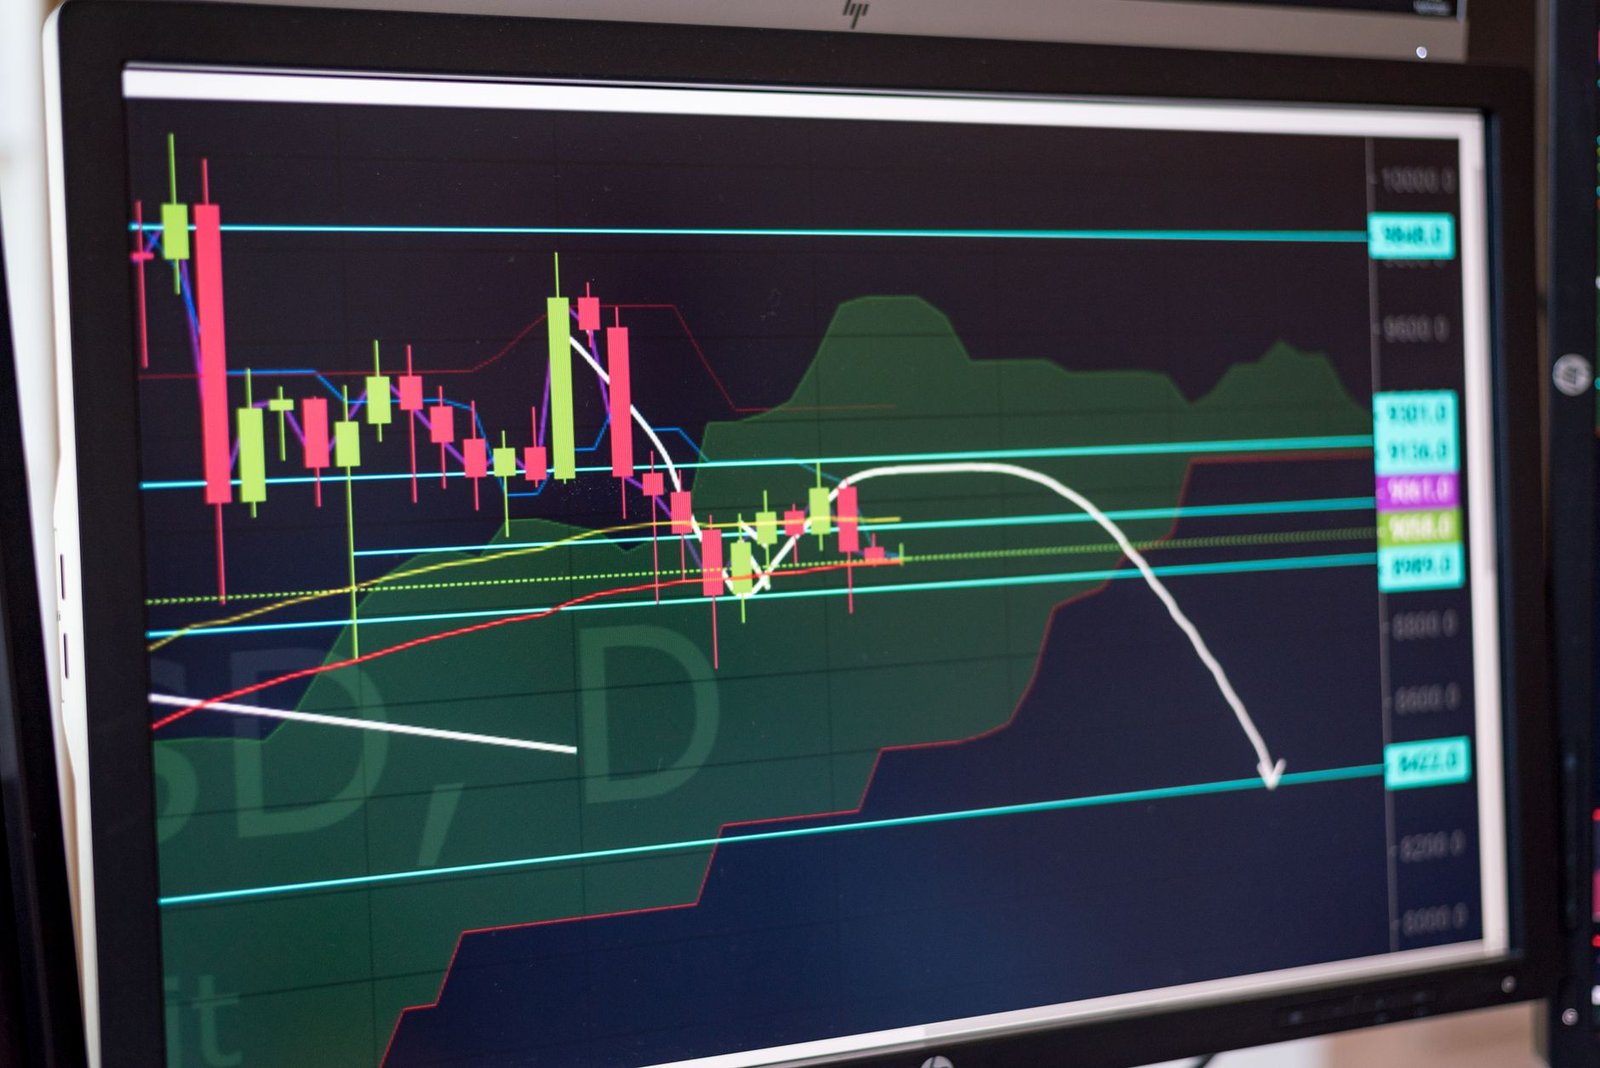
These are the most common and easily identifiable levels, drawn as horizontal lines connecting previous price highs (resistance) or lows (support). They represent price points where significant buying or selling pressure has historically occurred, irrespective of the overall trend.
Trendline Support and Resistance
Trendlines are diagonal lines drawn on a chart connecting a series of higher lows (uptrend support) or lower highs (downtrend resistance). They are dynamic and change as the trend progresses, offering support or resistance that moves with the price.
Moving Average Support and Resistance
Moving averages (like the 50-day or 200-day moving average) can act as dynamic support or resistance. As the price moves, it may find support at a rising moving average or resistance at a falling moving average, especially in established trends.
Psychological Support and Resistance
These are often based on round numbers (e.g., ₹100, ₹500, ₹1000). Because many traders tend to place orders around these psychological levels, they can become self-fulfilling prophecies of support or resistance, even if not historically significant on charts.
Dynamic Support and Resistance
This term refers to support and resistance levels that are not static but move with price. Trendlines and moving averages are prime examples. As price changes, these levels adjust, offering a constantly evolving reference point for traders.
When Support Becomes Resistance and Vice Versa
A critical concept in trading is the polarity principle: when a support level is decisively broken, it often transforms into a resistance level for future price movements. Conversely, when a resistance level is decisively broken, it tends to become a support level. This ‘role reversal’ is a common phenomenon observed in market behaviour and is key to anticipating future price action.
The Polarity Principle Explained
Imagine a stock price is falling and finds support at ₹500, bouncing back up. If the price later falls again and breaks decisively below ₹500, that ₹500 level, which was previously a floor, now becomes a ceiling. When the price rallies back towards ₹500, sellers might emerge there, turning it into resistance.
Practical Application of Polarity
Traders look for confirmation of a level’s new role. For instance, after a support breaks, if the price rallies back to that broken level and fails to move higher, it confirms the polarity shift. This confirmation provides an opportunity for a short trade or to adjust existing long positions.
Common Mistakes Traders Make with Support and Resistance
Even experienced traders can falter when using support and resistance. Awareness of common pitfalls can help prevent costly errors and improve trading outcomes. Many of these mistakes stem from impatience or over-reliance on a single indicator.
Ignoring Volume
A breakout or breakdown that occurs on low volume is less reliable than one accompanied by high volume, suggesting stronger conviction behind the price move.
Trading Without Confirmation
Entering a trade solely because the price has touched a support or resistance level, without waiting for confirming price action or indicators, can lead to premature entries and losses.
Over-reliance on a Single Level
Treating a single price level as an impenetrable barrier is a mistake. Prices can consolidate, form zones, or break through levels unexpectedly. A broader perspective considering price action over time is crucial.
Not Adjusting for Market Conditions
Support and resistance levels can weaken or strengthen depending on overall market sentiment, news events, or changes in trading volume. Failing to adapt to these changing conditions is detrimental.
Ignoring the Timeframe
Support and resistance levels identified on a daily chart might differ significantly from those on a 5-minute chart. Always consider the timeframe relevant to your trading strategy.

Frequently Asked Questions
What is the most reliable way to identify support and resistance?
Combining multiple methods is best: look for historical price action (previous highs/lows), trendlines, moving averages, and even Fibonacci retracement levels. Volume confirmation also adds reliability.
Should I trade exactly at support or resistance levels?
It’s generally safer to wait for confirmation. Look for the price to bounce off support or break resistance, or for specific candlestick patterns, before entering a trade.
How many support and resistance levels should I look for?
Focus on the most significant levels on your chosen timeframe. Too many levels can create confusion. Prioritize those that have been tested multiple times.
Can support and resistance levels change over time?
Yes, their significance can diminish if broken decisively. However, once broken, they often flip roles (support becomes resistance, and vice versa), remaining relevant in their new capacity.
Are support and resistance levels guaranteed to hold?
No, they are not guarantees. They represent areas of potential price reaction based on historical behaviour. Breakouts and breakdowns happen frequently.
Key Takeaways
- Support and resistance are fundamental price levels where trends may pause or reverse.
- Identify support by past price lows and resistance by past price highs.
- The polarity principle states that broken support often becomes resistance, and vice versa.
- Use these levels for entry/exit points, stop-loss placement, and profit targets.
- Confirmation of price action at these levels is crucial for successful trading.
- Volume analysis and considering multiple timeframes enhance the effectiveness of support/resistance analysis.
- Avoid common mistakes like trading without confirmation or ignoring volume.
Trading involves risks, and past performance is not indicative of future results.




 Finovatives