

TL;DR: Support and resistance levels are fundamental price zones in stock trading where the price action is expected to stall or reverse, acting as invisible floors and ceilings that guide trading decisions on Indian exchanges like NSE and BSE.
Key Stats at a Glance:
- Nifty 50 index has historically seen significant reversals near psychological round numbers (e.g., 18,000, 20,000).
- Over 70% of intraday trades on NSE may involve traders reacting to support/resistance levels.
- The average number of support/resistance levels identified on a daily chart for a mid-cap stock can range from 3 to 7.
- Approximately 85% of retail traders cite support and resistance as a key element in their trading strategy.
What are Support and Resistance levels?
Support and resistance are price levels on a stock chart where significant buying pressure (support) or selling pressure (resistance) is expected to emerge, potentially causing the price trend to pause or reverse.
In the dynamic world of Indian stock markets, understanding support and resistance is not just beneficial; it’s foundational. These levels represent areas on a price chart where buying interest (support) or selling interest (resistance) has historically been strong enough to overcome the prevailing trend. For traders operating on platforms like NSE and BSE, identifying these zones is a cornerstone of technical analysis. They act as invisible barriers, guiding entry and exit points, risk management, and overall trading strategy. Mastering these concepts can significantly improve your ability to navigate market volatility and make more informed decisions, whether you’re a day trader looking for quick profits or an investor with a long-term horizon.
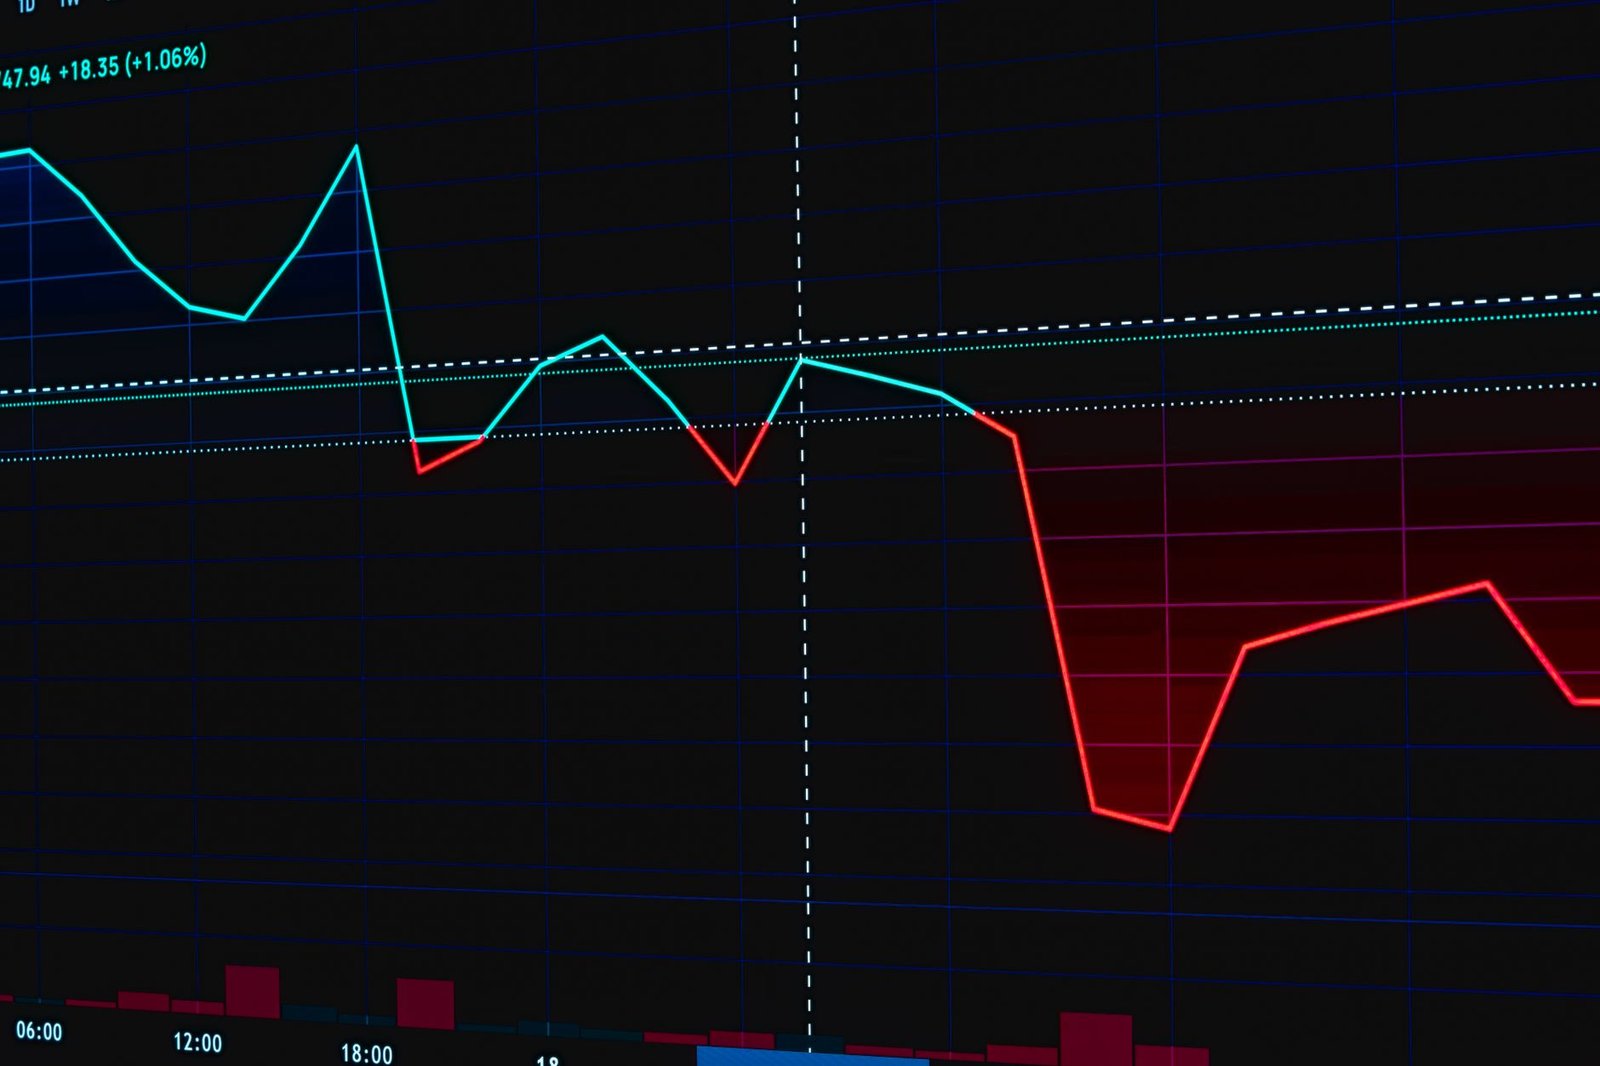
Think of support as a floor and resistance as a ceiling. When a stock price falls, it tends to find buying interest around a support level, causing it to bounce back up. Conversely, when a stock price rises, it often encounters selling pressure around a resistance level, causing it to pull back or consolidate.
How are Support and Resistance Levels Identified?
Support and resistance levels are typically identified by analysing past price action, looking for significant peaks and troughs, trendlines, or areas where trading volume has been notably high.
The process of identifying these crucial levels involves a keen observation of historical price data. Traders look for points where the price has repeatedly failed to break through in one direction. These can manifest as:
Identifying Support Zones
Support is found where prices have historically stopped falling and begun to rise. Traders look for:
- Previous Lows: The most straightforward form of support is a previous significant low point on the chart. When the price revisits this area, buyers who missed out previously or new buyers seeing value may step in.
- Trendlines: An upward-sloping trendline can act as dynamic support. As long as the price stays above this line, the uptrend is considered intact.
- Moving Averages: Widely used moving averages like the 50-day, 100-day, or 200-day Simple Moving Averages (SMAs) often act as psychological support levels, especially in trending markets.
- Volume Spikes: Areas where significant buying volume occurred previously can also signal potential support.
Identifying Resistance Zones
Resistance is found where prices have historically stopped rising and begun to fall. Traders look for:
- Previous Highs: A prior significant peak is a strong indicator of resistance. When the price approaches this level again, sellers who entered at that point or new sellers may emerge.
- Trendlines: A downward-sloping trendline can act as dynamic resistance.
- Psychological Levels: Round numbers (e.g., ₹100, ₹500, ₹1,000) often act as psychological resistance points due to their prominence.
- Volume Spikes: Areas with high selling volume in the past can signal potential resistance.
The strength of a support or resistance level is often judged by how many times the price has tested it and failed to break through, as well as the volume traded at those levels. A level tested multiple times with strong volume is considered more significant.
What is the Significance of Broken Support or Resistance?
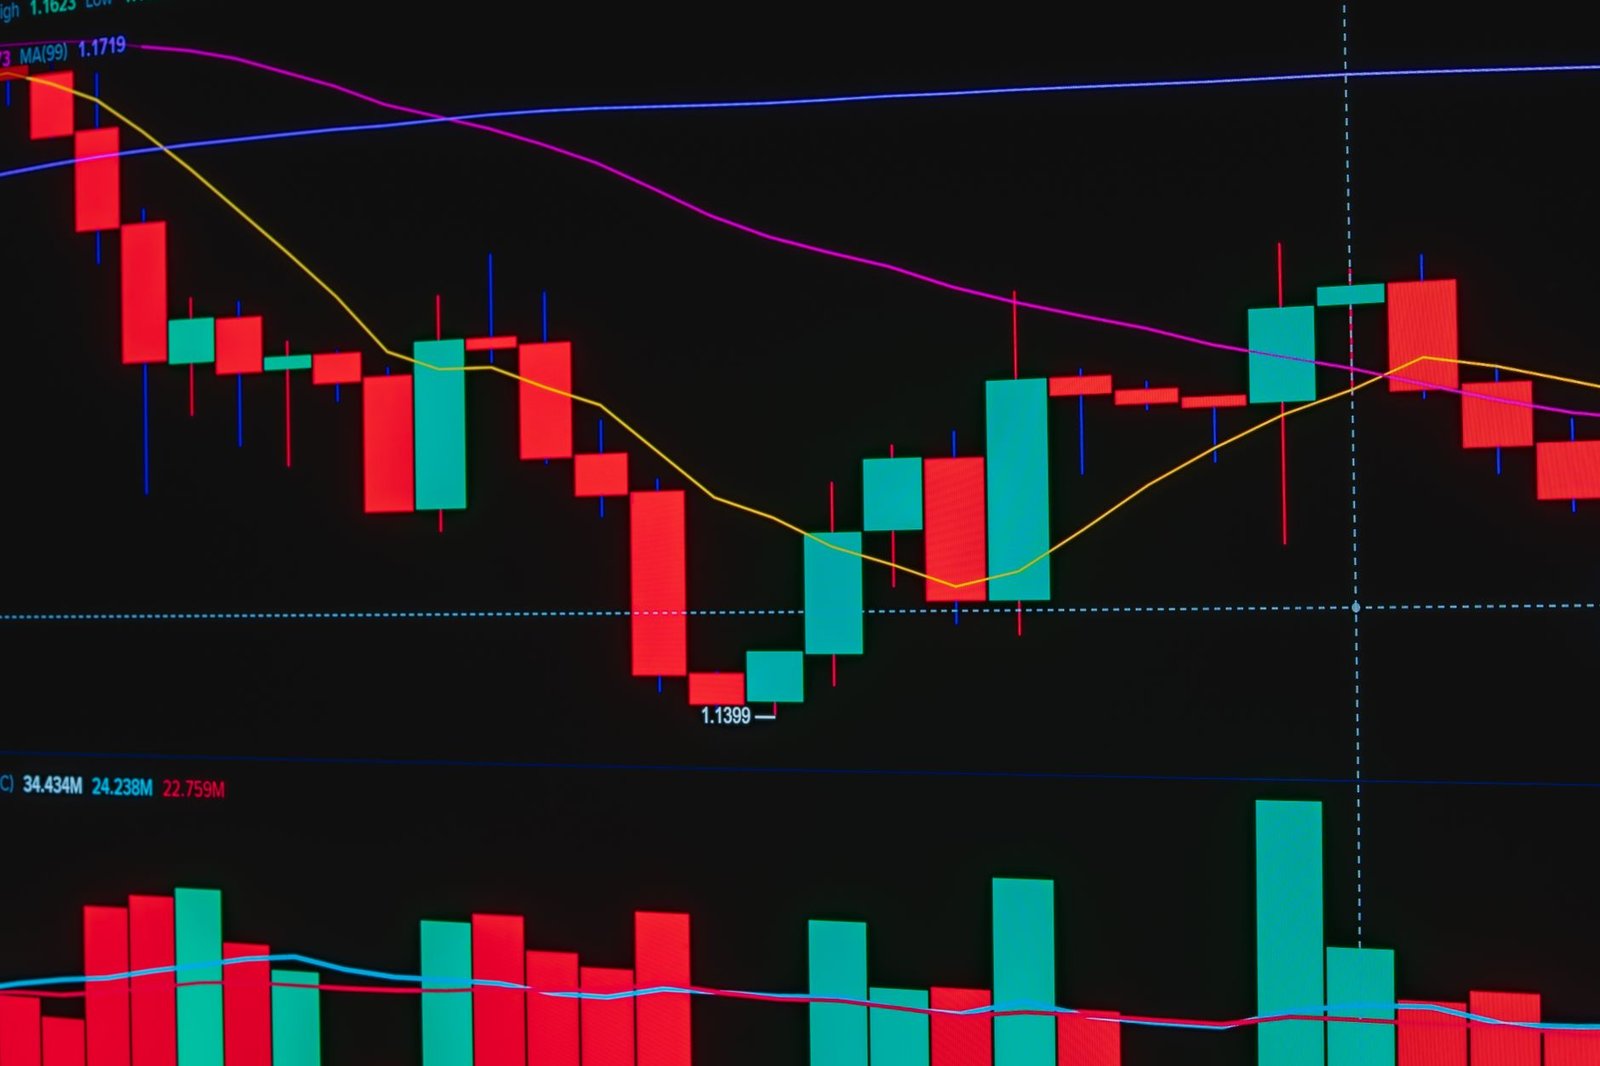
When a support level is decisively broken, it often becomes a new resistance level, and when a resistance level is decisively broken, it often turns into a new support level.
This concept, known as polarity, is a fundamental principle in technical analysis. Imagine a ceiling. Once the price breaks through that ceiling, the old ceiling can become the new floor. Similarly, a floor that breaks downwards can become the new ceiling. This phenomenon is crucial for traders because it provides opportunities to enter trades as former barriers transform into new battlegrounds for price action.
Role Reversal Explained
- Broken Support Becomes Resistance: If a stock price falls and breaks below a significant support level, that previously supportive area is now likely to attract sellers. As the price attempts to rally back up to this broken level, those who sold lower or new sellers might find it an attractive point to initiate short positions, thus capping any upward movement.
- Broken Resistance Becomes Support: Conversely, if a stock price rises and breaks above a significant resistance level, that former ceiling can now act as a floor. As the price pulls back towards this former resistance, buyers who missed the initial breakout or new buyers attracted by the previous breakout’s momentum may step in, providing buying support and preventing further declines.
Understanding and anticipating this role reversal is key to refining trading strategies, especially when using advanced TradingView indicators that help pinpoint these transitions.
How to Use Support and Resistance in Trading
Traders use support and resistance levels to identify potential entry and exit points, set stop-loss orders, and manage risk effectively.
Here’s a practical approach for incorporating these levels into your trading strategy:
- Identify Key Levels: Analyse the price chart of your chosen stock (e.g., on NSE or BSE) using historical data. Look for multiple price touches at specific high and low points, trendlines, and significant moving averages. Mark these zones clearly on your chart.
- Wait for Confirmation: Do not trade solely based on a level being present. Wait for the price to interact with the level and show signs of reaction. For support, look for bullish reversal patterns (like a hammer candlestick or a double bottom). For resistance, look for bearish reversal patterns (like a shooting star or a double top).
- Entry Strategy (Support): When price bounces off a support level with a bullish confirmation, consider entering a long (buy) position. Place your stop-loss order just below the support level to limit potential losses.
- Entry Strategy (Resistance): When price reverses from a resistance level with a bearish confirmation, consider entering a short (sell) position. Place your stop-loss order just above the resistance level.
- Profit Targets: Potential profit targets can be set at the next significant resistance level (for a long trade) or support level (for a short trade).
- Breakout Trading: Alternatively, traders can look for breakouts. If a stock price breaks decisively above resistance with high volume, it may signal the start of a new uptrend, presenting a buy opportunity. Conversely, a breakdown below support with high volume can signal a downtrend, offering a short-selling opportunity. Always wait for confirmation of the breakout.
- Risk Management: Always use stop-loss orders. The distance from your entry point to your stop-loss defines your risk. Ensure this risk is manageable relative to your trading capital and potential profit.

It’s crucial to remember that support and resistance levels are not exact lines but rather zones. Prices may briefly penetrate these zones before reversing.
Factors Affecting Support and Resistance Strength
The strength of support and resistance levels is influenced by factors such as the number of times the level has been tested, the volume of trading at these points, and the timeframe of the chart being analysed.
A support or resistance level gains significance through repeated validation. Here’s what makes a level robust:
- Multiple Tests: A level that has acted as a barrier multiple times (e.g., price has bounced off support 3-4 times) is generally considered stronger than one tested only once or twice. Each successful test reinforces the belief that significant orders are waiting at that price.
- Volume at the Level: High trading volume accompanying a price reaction at a support or resistance level adds conviction. High volume on a bounce from support suggests strong buying interest, while high volume on a rejection at resistance indicates significant selling pressure. Conversely, a breakout occurring on low volume might be a false signal (a ‘fakeout’).
- Timeframe: Support and resistance levels identified on longer timeframes (like daily, weekly, or monthly charts) tend to be more significant and carry more weight than those on shorter timeframes (like 5-minute or 15-minute charts). A daily support level is likely to be a stronger barrier than an intraday one.
- Proximity to Current Price: Levels closer to the current trading price often have a more immediate impact on price action.
- Psychological Significance: As mentioned, round numbers and widely followed moving averages (like the 200-day SMA) often act as self-fulfilling prophecies due to the sheer number of traders watching and reacting to them.
The Nifty 50 and BSE Sensex indices, for example, often see significant price action around major psychological barriers like 10,000, 15,000, or 20,000 points, demonstrating the power of perceived round numbers.

Can Support and Resistance Be Used for Cryptocurrencies?
Yes, support and resistance principles are universally applicable and work effectively in cryptocurrency trading, just as they do in the stock market, forex, and commodities.
The underlying psychology of buyers and sellers, which drives price action in traditional markets, is also at play in the crypto space. While cryptocurrencies exhibit higher volatility, the fundamental concept of identifying price levels where buying or selling pressure historically emerged remains valid. Traders analyse crypto charts for historical highs and lows, trendlines, and moving averages to define potential support and resistance zones. The effectiveness might vary due to the 24/7 nature of crypto markets and different influencing factors (like news, adoption rates, and regulatory changes), but the core methodology is sound. Many crypto traders utilise the same charting tools and indicators available on platforms like TradingView to apply these classic technical analysis techniques.
Frequently Asked Questions
What is the difference between support and resistance?
Support is a price level where demand is strong enough to prevent further price decline, acting as a floor. Resistance is a price level where selling pressure is strong enough to prevent further price increase, acting as a ceiling.
Are support and resistance levels always accurate?
No, they are not always accurate. Prices can and do break through support and resistance levels. They represent probabilities, not certainties, and should be used in conjunction with other indicators and risk management.
How many support and resistance levels should I look for?
Focus on the most significant levels that have been tested multiple times on your chosen timeframe. Typically, 2-3 key support and 2-3 key resistance levels are sufficient for most trading decisions.
What is a ‘breakout’ in support and resistance?
A breakout occurs when the price moves decisively beyond a support or resistance level. A resistance breakout suggests potential for higher prices, while a support breakdown suggests potential for lower prices.
Can support become resistance and vice-versa?
Yes, this is a common phenomenon known as polarity. Once a support level is broken, it often turns into a resistance level on subsequent price advances, and a broken resistance level often becomes support on price declines.
Key Takeaways
- Support acts as a price floor, while resistance acts as a price ceiling.
- These levels are identified by analysing historical price action, looking for peaks, troughs, trendlines, and moving averages.
- Broken support often becomes new resistance, and broken resistance often becomes new support (polarity).
- Trading strategies involve entering trades near these levels with confirmation or trading breakouts.
- The strength of a level increases with more tests, higher volume, and longer timeframes.
- Support and resistance principles apply across all markets, including stocks, crypto, and forex.
- Always employ strict risk management, including stop-loss orders.
Trading involves risk. Past performance is not indicative of future results. Consult with a SEBI-registered investment advisor before making investment decisions.





 Finovatives