

TL;DR: Analyzing the Indian stock market like a pro involves a dual approach: understanding the company’s intrinsic value through fundamental analysis and predicting price movements using technical analysis, all while staying informed about macroeconomic factors and regulatory changes overseen by SEBI.
Key Stats at a Glance:
- Nifty 50’s average annual return (historically): ~12-14%
- BSE Sensex’s market capitalization: Over ₹300 lakh crore
- Number of listed companies on NSE: 2,000+
- SEBI’s regulatory framework: Governs all market participants
- Retail investor participation growth: Significant increase in the last 5 years
What is Stock Market Analysis?
Stock market analysis is the process of evaluating securities, sectors, and markets to determine their future performance and potential for investment. It involves studying financial data, economic trends, and market sentiment to make informed buy, sell, or hold decisions.
How to Analyze the Indian Stock Market Like a Pro?
To analyze the Indian stock market like a pro, traders must integrate fundamental analysis to assess a company’s health and intrinsic value, technical analysis to identify trading patterns and momentum, and a keen awareness of macroeconomic indicators and regulatory influences from bodies like SEBI.
Fundamental Analysis: The Bedrock of Value Investing
Fundamental analysis focuses on the intrinsic value of a stock by examining a company’s financial health, management quality, competitive landscape, and economic conditions. It’s about understanding the ‘why’ behind a stock’s price, believing that the market price will eventually reflect the true value.
Key Financial Ratios to Consider:
- Earnings Per Share (EPS): A company’s net profit divided by the number of outstanding shares. A rising EPS often indicates profitability.
- Price-to-Earnings (P/E) Ratio: Stock price divided by EPS. It shows how much investors are willing to pay for each rupee of earnings. A high P/E might suggest overvaluation, while a low P/E could indicate undervaluation or risk.
- Debt-to-Equity (D/E) Ratio: Measures a company’s financial leverage. A lower ratio is generally preferred, indicating less reliance on debt.
- Return on Equity (ROE): Net income divided by shareholders’ equity. It measures how effectively a company generates profits from its shareholders’ investments.
Beyond ratios, a thorough fundamental analysis includes examining the company’s business model, management’s track record, industry outlook, and competitive advantages. For Indian markets, understanding the impact of government policies and regulatory changes from SEBI is crucial.
Macroeconomic Factors: The Bigger Picture
The Indian economy’s performance significantly impacts the stock market. Key factors include:
- GDP Growth: A growing economy generally supports corporate earnings and stock prices.
- Inflation Rates: High inflation can erode purchasing power and corporate profits, often leading the RBI to tighten monetary policy.
- Interest Rates: Higher interest rates can make borrowing more expensive for companies and make fixed-income investments more attractive, potentially lowering stock valuations.
- Monetary Policy: Decisions by the Reserve Bank of India (RBI) on interest rates and liquidity significantly influence market sentiment and borrowing costs.
- Fiscal Policy: Government spending and taxation policies can stimulate or dampen economic activity.
Technical Analysis: Reading the Market’s Pulse
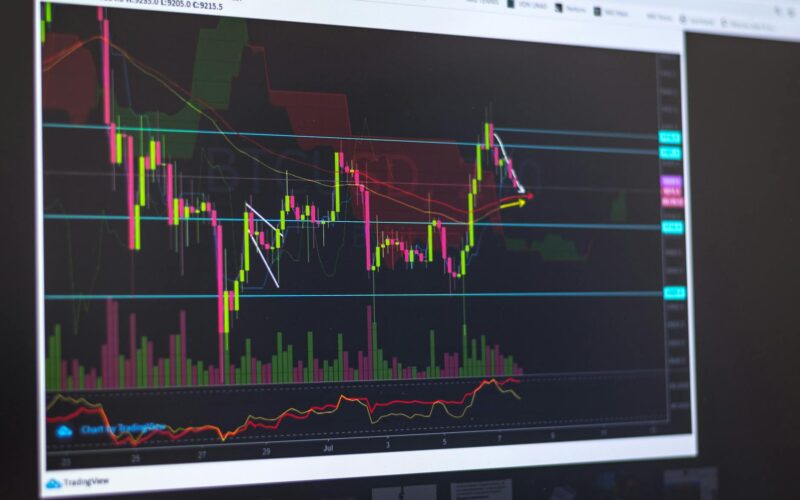
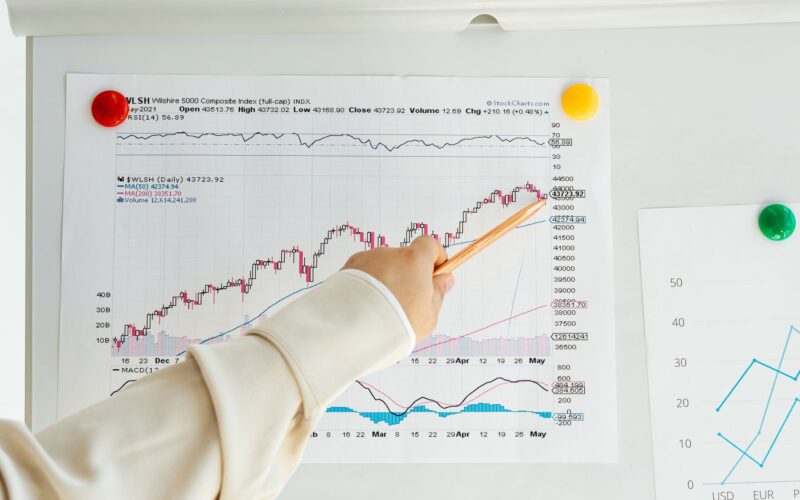
Technical analysis involves studying historical price and volume data to forecast future price movements. Technical analysts believe that all relevant information is already reflected in the stock price and that prices move in trends.
Key Technical Tools and Indicators:
- Chart Patterns: Formations like head and shoulders, double tops/bottoms, triangles, and flags can indicate potential trend reversals or continuations.
- Support and Resistance Levels: These are price levels where a stock has historically found it difficult to fall below (support) or rise above (resistance).
- Moving Averages (MAs): Such as the 50-day and 200-day moving averages, are used to identify trends and potential buy/sell signals when shorter-term averages cross longer-term ones.
- Volume Analysis: The amount of trading activity. High volume accompanying a price move can confirm the strength of that move.
- Oscillators: Indicators like the Relative Strength Index (RSI) and MACD help identify overbought or oversold conditions and momentum.
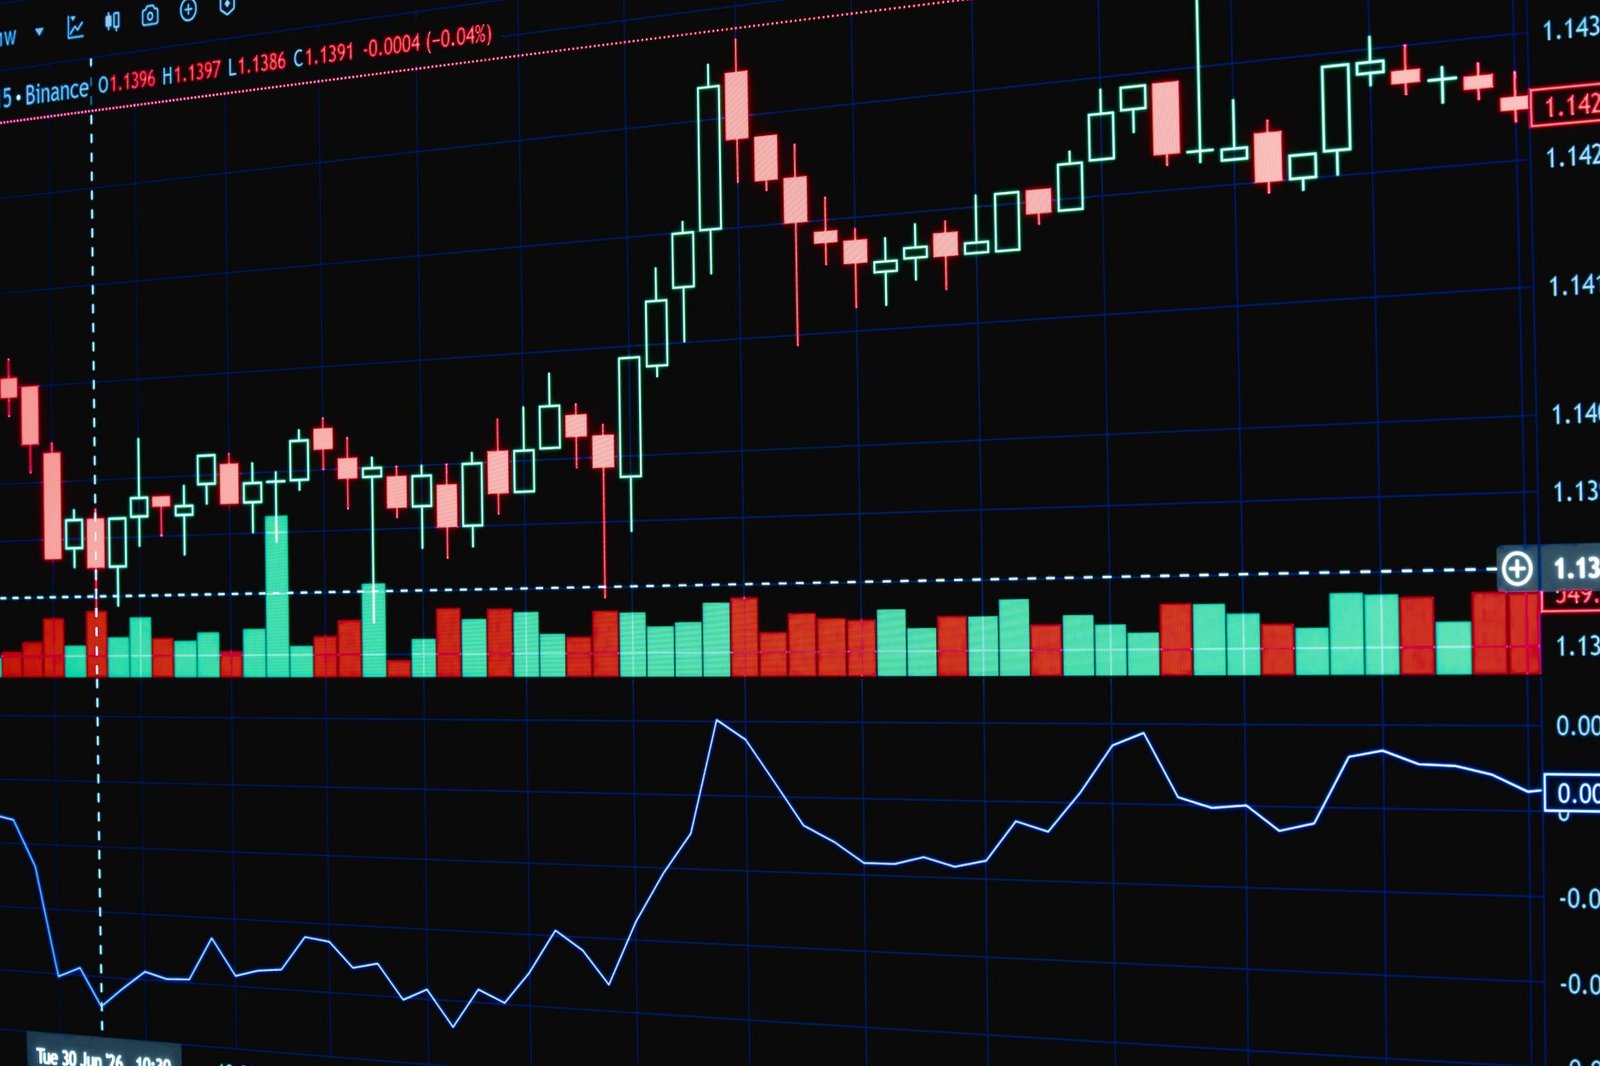
Leveraging advanced TradingView indicators can significantly enhance technical analysis by providing real-time data and automated signal generation.
How to Develop a Trading Strategy?
A well-defined trading strategy is essential for consistent profitability. It acts as a roadmap, guiding decisions and helping to manage risk.
- Define Your Goals: Are you seeking short-term gains or long-term wealth creation? This dictates your trading style (e.g., day trading, swing trading, long-term investing).
- Choose Your Analysis Method: Decide whether to primarily use fundamental, technical, or a blend of both.
- Select Your Markets/Stocks: Focus on specific sectors or types of stocks you understand well. For Indian traders, this means familiarizing oneself with NSE and BSE listed entities.
- Develop Entry and Exit Rules: Clearly define the conditions under which you will enter a trade and, crucially, when you will exit (both for profit-taking and loss-cutting).
- Implement Risk Management: Determine how much capital you will risk per trade (e.g., 1-2% of your total capital) and use stop-loss orders to limit potential losses.
- Backtest and Refine: Test your strategy on historical data to see how it would have performed and make adjustments.
- Execute Disciplined Trading: Stick to your strategy, avoid emotional decisions, and continuously learn from your trades.
Understanding Market Sentiment and News
Market sentiment refers to the general attitude of investors towards a particular security or the market as a whole. It can be influenced by news, economic data, political events, and even social media trends. While fundamental and technical analysis provide objective data, sentiment can drive short-term price movements. Staying updated with reputable financial news sources and understanding how events might affect investor psychology is vital.
The SEBI actively works to ensure market integrity and transparency, which can influence sentiment. For instance, new regulations or enforcement actions can create uncertainty or confidence.

Risk Management: The Professional Trader’s Mantra
No trading strategy is foolproof, and losses are an inevitable part of trading. Professional traders prioritize risk management to protect their capital. This involves:
- Position Sizing: Calculating the appropriate number of shares or contracts to trade based on your risk tolerance and the stock’s volatility.
- Stop-Loss Orders: Pre-determined price levels at which a losing trade is automatically closed to cap losses.
- Diversification: Spreading investments across different asset classes, sectors, or geographies to reduce overall risk (though this is more for investors than short-term traders).
- Avoiding Over-Leverage: Using borrowed funds cautiously, as it magnifies both potential profits and losses.
A sophisticated tool like the Trend Traders Tool can help in identifying potential entry and exit points while adhering to risk management principles.
Staying Updated with SEBI and Economic Policies
The Indian stock market operates within a strict regulatory framework overseen by the Securities and Exchange Board of India (SEBI). Understanding SEBI’s guidelines, new circulars, and enforcement actions is crucial for traders. Similarly, awareness of government economic policies, budget announcements, and RBI’s monetary policy decisions can provide significant insights into market direction and opportunities.

Frequently Asked Questions
What is the most important factor in stock market analysis?
While multiple factors are important, understanding a company’s fundamental strength combined with market trends (through technical analysis) and sound risk management is paramount for long-term success.
How often should I analyze my investments?
For active traders, daily or intra-day analysis is common. Long-term investors might review their portfolio quarterly or annually, focusing more on fundamental changes.
Can I make money trading without technical analysis?
Yes, purely fundamental investors can be successful, but technical analysis helps in timing entries and exits, potentially improving profitability and managing risk for traders.
What is the role of SEBI in the Indian stock market?
SEBI is the primary regulator, responsible for protecting investor interests, promoting market development, and ensuring fair and transparent trading practices on exchanges like NSE and BSE.
How can I start analyzing the Indian stock market?
Begin by learning the basics of fundamental and technical analysis, practice with paper trading, and stay updated with market news and economic indicators relevant to India.
Key Takeaways
- A professional approach to analyzing the Indian stock market requires a blend of fundamental and technical analysis.
- Fundamental analysis helps determine a stock’s intrinsic value by examining financial health and economic factors.
- Technical analysis uses historical price and volume data to predict future price movements and identify trading opportunities.
- Macroeconomic factors and regulatory policies (especially from SEBI) significantly influence market dynamics.
- Robust risk management strategies, including stop-loss orders and proper position sizing, are crucial for capital preservation.
- Staying informed about news, sentiment, and economic policies is vital for making timely trading decisions.
- Consistent learning and disciplined execution are hallmarks of successful traders.
Disclaimer: Stock market investments are subject to market risks. Read all related documents carefully before investing. This content is for educational purposes only and not financial advice.




 Finovatives