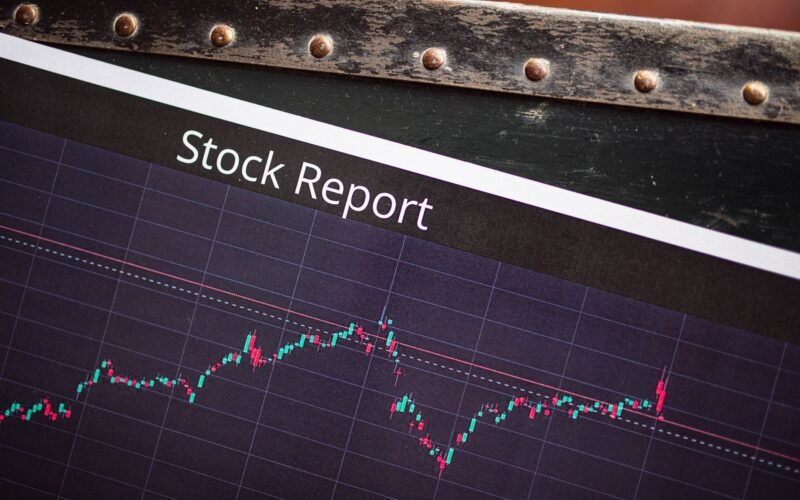
TL;DR: Analyzing the Indian stock market like a pro involves a blend of fundamental analysis (evaluating a company’s intrinsic value) and technical analysis (studying price charts and patterns), coupled with a disciplined approach to risk management and continuous learning.
Key Stats at a Glance:
- Nifty 50’s average annual return (historical, not guaranteed): ~12-14%
- BSE Sensex listed companies: Over 5,000
- Average daily trading volume on NSE: ₹60,000+ Crore (as of recent data)
- Number of SEBI-registered mutual funds: 40+ Asset Management Companies (AMCs)
- Retail investor participation: Increased by over 30% in the last 3 years
What is Stock Market Analysis?
Stock market analysis is the process of evaluating securities, such as stocks, bonds, and commodities, to determine their future potential and make informed investment or trading decisions.
The Two Pillars: Fundamental vs. Technical Analysis
At its core, stock market analysis is divided into two primary methodologies: fundamental analysis and technical analysis. While often used in conjunction, they offer distinct perspectives on market behaviour and security valuation.
Fundamental Analysis: The Business Valuation Approach
Fundamental analysis focuses on the intrinsic value of a security by examining related economic, financial, and other qualitative and quantitative factors. For stocks, this typically involves evaluating the health and prospects of the issuing company. Investors using fundamental analysis aim to identify securities that are trading below their perceived true worth (undervalued) or above their perceived true worth (overvalued).
Key Metrics in Fundamental Analysis
- Earnings Per Share (EPS): A company’s profit divided by the outstanding shares. Higher EPS generally indicates greater profitability.
- Price-to-Earnings (P/E) Ratio: Stock price divided by EPS. It helps gauge if a stock is overvalued or undervalued relative to its earnings. A high P/E might suggest growth expectations, while a low P/E could signal undervaluation or underlying problems.
- Debt-to-Equity Ratio: Measures a company’s financial leverage. A high ratio indicates higher risk.
- Return on Equity (ROE): Net income divided by shareholder equity. It shows how effectively a company is using its shareholders’ investments to generate profits.
- Dividend Yield: Annual dividend per share divided by the stock price. It indicates the income generated from dividends.

Understanding a company’s financial statements (Balance Sheet, Income Statement, Cash Flow Statement) is crucial for a thorough fundamental analysis. Looking at macroeconomic factors like GDP growth, inflation, interest rates, and government policies, as dictated by bodies like the Reserve Bank of India (RBI), also plays a significant role, especially in analyzing the broader Indian market indices like the Nifty 50 or BSE Sensex.
Technical Analysis: Charting the Market’s Psychology
Technical analysis is a trading discipline employed to evaluate securities and identify trading opportunities by analyzing statistical trends gathered from trading activity, such as price movement and volume. Technical analysts believe that past trading activity and price changes can be indicators of future price movements. They study price charts, patterns, and indicators to predict future price action.
Common Technical Analysis Tools and Concepts
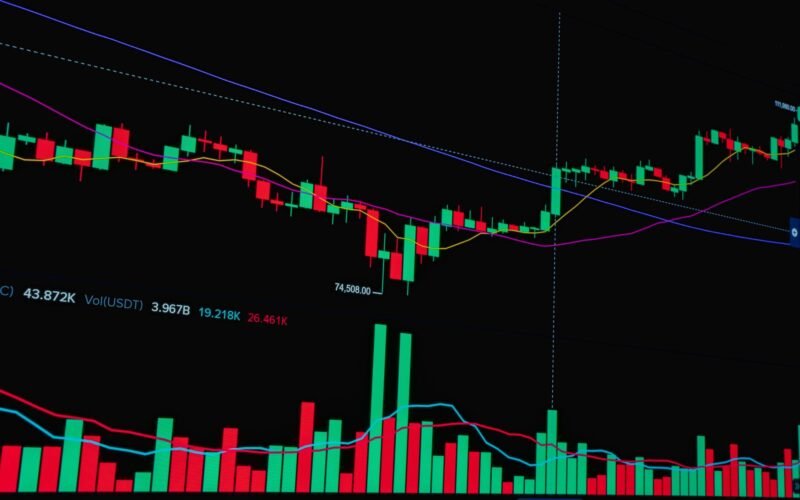
- Candlestick Charts: These charts display the high, low, open, and closing prices for a given period, forming patterns that traders interpret.
- Support and Resistance Levels: Price levels where a stock has historically tended to stop falling (support) or stop rising (resistance).
- Moving Averages: Calculations of average prices over a specific period, used to smooth out price data and identify trends (e.g., 50-day, 200-day moving averages).
- Volume: The number of shares traded during a specific period. High volume often confirms a price trend.
- Chart Patterns: Formations on price charts (e.g., Head and Shoulders, Double Bottom, Triangles) that technical analysts believe predict future price movements.
- Technical Indicators: Mathematical calculations based on price and volume (e.g., RSI, MACD, Bollinger Bands) used to gauge momentum, volatility, and trend strength. Many traders find custom TradingView indicators invaluable here.

How to Analyze the Indian Stock Market Effectively
Combining both fundamental and technical analysis provides a more robust framework for making trading and investment decisions in the dynamic Indian stock market.
How to Analyze the Indian Stock Market: A Step-by-Step Approach
- Define Your Investment Goals: Determine whether you are looking for short-term trading profits or long-term wealth creation. This will influence the type of analysis you prioritize.
- Choose Your Market Segments: Decide whether to focus on large-cap stocks (like those in the Nifty 50), mid-caps, small-caps, commodities (MCX), or currency futures (Forex).
- Conduct Fundamental Analysis: Research companies using financial statements, P/E ratios, EPS, and management quality. Assess the overall economic outlook for India and the specific sector.
- Perform Technical Analysis: Study price charts, identify trends, support/resistance levels, and use indicators like Moving Averages or RSI to find entry and exit points. Explore specialized TradingView indicators for deeper insights.
- Analyze Market Sentiment: Gauge the overall mood of the market through news, social media trends, and analyst reports. Is it fearful, greedy, or neutral?
- Incorporate Risk Management: Always use stop-loss orders to limit potential losses and diversify your portfolio to reduce concentration risk. The Finovatives Trend Traders Tool can assist in managing risk effectively.
- Stay Updated and Adapt: Continuously monitor market news, economic data releases, and company announcements. Be prepared to adjust your strategy based on new information.
- Backtest and Refine: Test your chosen strategies on historical data and refine them based on performance. A free trial of advanced tools can be beneficial for this.
Understanding Market Indices: Nifty 50 and BSE Sensex
Major stock market indices, such as the Nifty 50 (representing 50 large, liquid Indian companies) and the BSE Sensex (representing 30 established companies), serve as benchmarks for the overall health of the Indian stock market. Analyzing their movements provides insights into market trends and investor sentiment. These indices are crucial for understanding sector performance and broad market direction, as reported by NSE and BSE.

Sectoral Analysis: Digging Deeper
Beyond individual stocks and broad indices, analyzing specific sectors (e.g., IT, Banking, Pharmaceuticals, FMCG) is vital. Understanding which sectors are poised for growth due to economic trends, government policies, or technological advancements can uncover hidden opportunities. For instance, a focus on infrastructure might be driven by government spending initiatives.
News and Events: The Immediate Impact
In the Indian market, news and events can cause rapid price fluctuations. Company-specific news (earnings reports, management changes, new product launches), industry-specific news (regulatory changes, technological disruptions), and macroeconomic events (RBI policy, Union Budget) all have an impact. Staying informed through reliable financial news sources is paramount.
Frequently Asked Questions
What is the most important factor in stock analysis?
There isn’t one single most important factor; a combination of thorough fundamental analysis (understanding business value) and technical analysis (understanding price action), alongside robust risk management, is crucial for consistent success.
How often should I analyze my portfolio?
For active traders, daily or weekly analysis is common. For long-term investors, quarterly or semi-annual reviews, coupled with monitoring significant market events, are generally sufficient.
Is technical analysis reliable for the Indian market?
Yes, technical analysis can be reliable when used with a sound understanding of its principles and in conjunction with fundamental analysis and risk management strategies appropriate for the Indian market’s volatility.
How can I start analyzing stocks with limited capital?
Start with fundamental research on well-established companies, use paper trading to practice technical analysis, and focus on a few stocks initially. Utilize readily available market data and analysis tools.
What role do macroeconomic factors play?
Macroeconomic factors like inflation, interest rates, and GDP growth significantly influence overall market sentiment and corporate profitability, impacting all stocks and sectors. Understanding these is key to contextualizing stock analysis.
Can I rely solely on charts for analysis?
Relying solely on charts is risky. While charts offer valuable insights into price trends and patterns, they do not account for underlying business fundamentals or unforeseen external events.

Key Takeaways
- Mastering both fundamental and technical analysis is essential for comprehensive stock market evaluation.
- Fundamental analysis helps identify a company’s intrinsic value, while technical analysis predicts price movements based on historical data.
- Key metrics like EPS, P/E ratio, and ROE are vital for fundamental assessment.
- Candlestick charts, moving averages, and volume are core components of technical analysis.
- A structured approach involving goal setting, research, risk management, and continuous learning is crucial.
- Understanding market indices (Nifty 50, BSE Sensex) and sectoral trends provides market context.
- Staying updated with news and adapting strategies is key in the volatile Indian stock market.
Disclaimer: Investing in the stock market involves inherent risks. Please consult with a qualified financial advisor before making any investment decisions.




 Finovatives