

TL;DR: Analyzing the Indian stock market like a pro requires a multi-faceted approach, integrating fundamental analysis (company health, financials), technical analysis (price charts, patterns), macroeconomic awareness (RBI policies, global trends), and sentiment tracking for informed trading and investment decisions.
Key Stats at a Glance:
- Nifty 50 Index Weightage: Driven by top 50 large-cap Indian companies.
- Average Daily Turnover on NSE: ₹8.5 Lakh Crore (as of recent data).
- Number of Listed Companies on BSE: Over 5,000.
- SEBI Mandated Trading Hours: 9:15 AM to 3:30 PM IST (equity segment).
- Foreign Institutional Investor (FII) Inflows: Crucial driver of market movements, often in billions of ₹.
What is Stock Market Analysis?
Stock market analysis is the process of evaluating securities, typically stocks, to determine their future price movements and investment potential. It aims to identify whether a stock is undervalued, overvalued, or fairly priced, guiding investment decisions.
The Indian stock market, comprising exchanges like the National Stock Exchange (NSE) and the Bombay Stock Exchange (BSE), presents a dynamic environment. Understanding its intricacies is crucial for retail traders and investors seeking to navigate its complexities and capitalize on opportunities. Professional analysis goes beyond simply looking at stock prices; it involves dissecting various layers of information to form a coherent investment thesis.
How Does Technical Analysis Help in Indian Stock Trading?
Technical analysis helps in Indian stock trading by studying past market data, primarily price and volume, to forecast future price trends and identify trading opportunities based on patterns and indicators.
Technical analysis forms the bedrock of short-to-medium term trading strategies. It operates on the principle that market psychology and historical price action tend to repeat themselves. Traders use charts and various tools to identify trends, support and resistance levels, and potential breakout or breakdown points. For instance, a trader might use a TradingView indicator to spot a bullish divergence on a stock like Reliance Industries, suggesting a potential price increase.
Understanding Candlestick Patterns
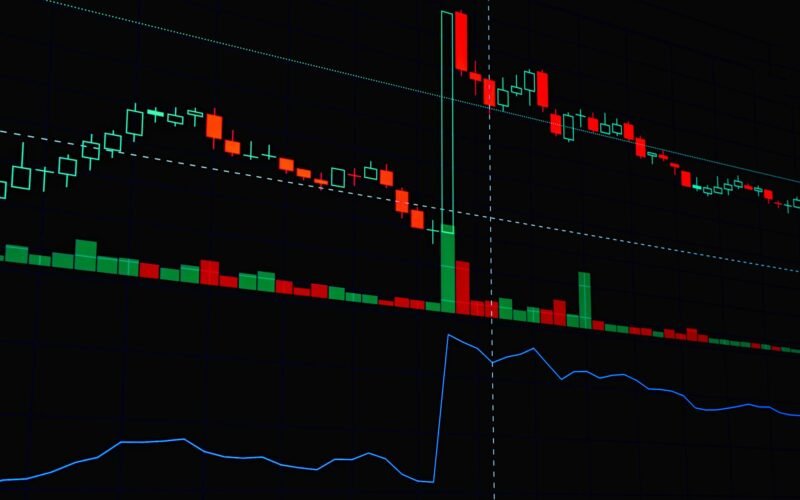
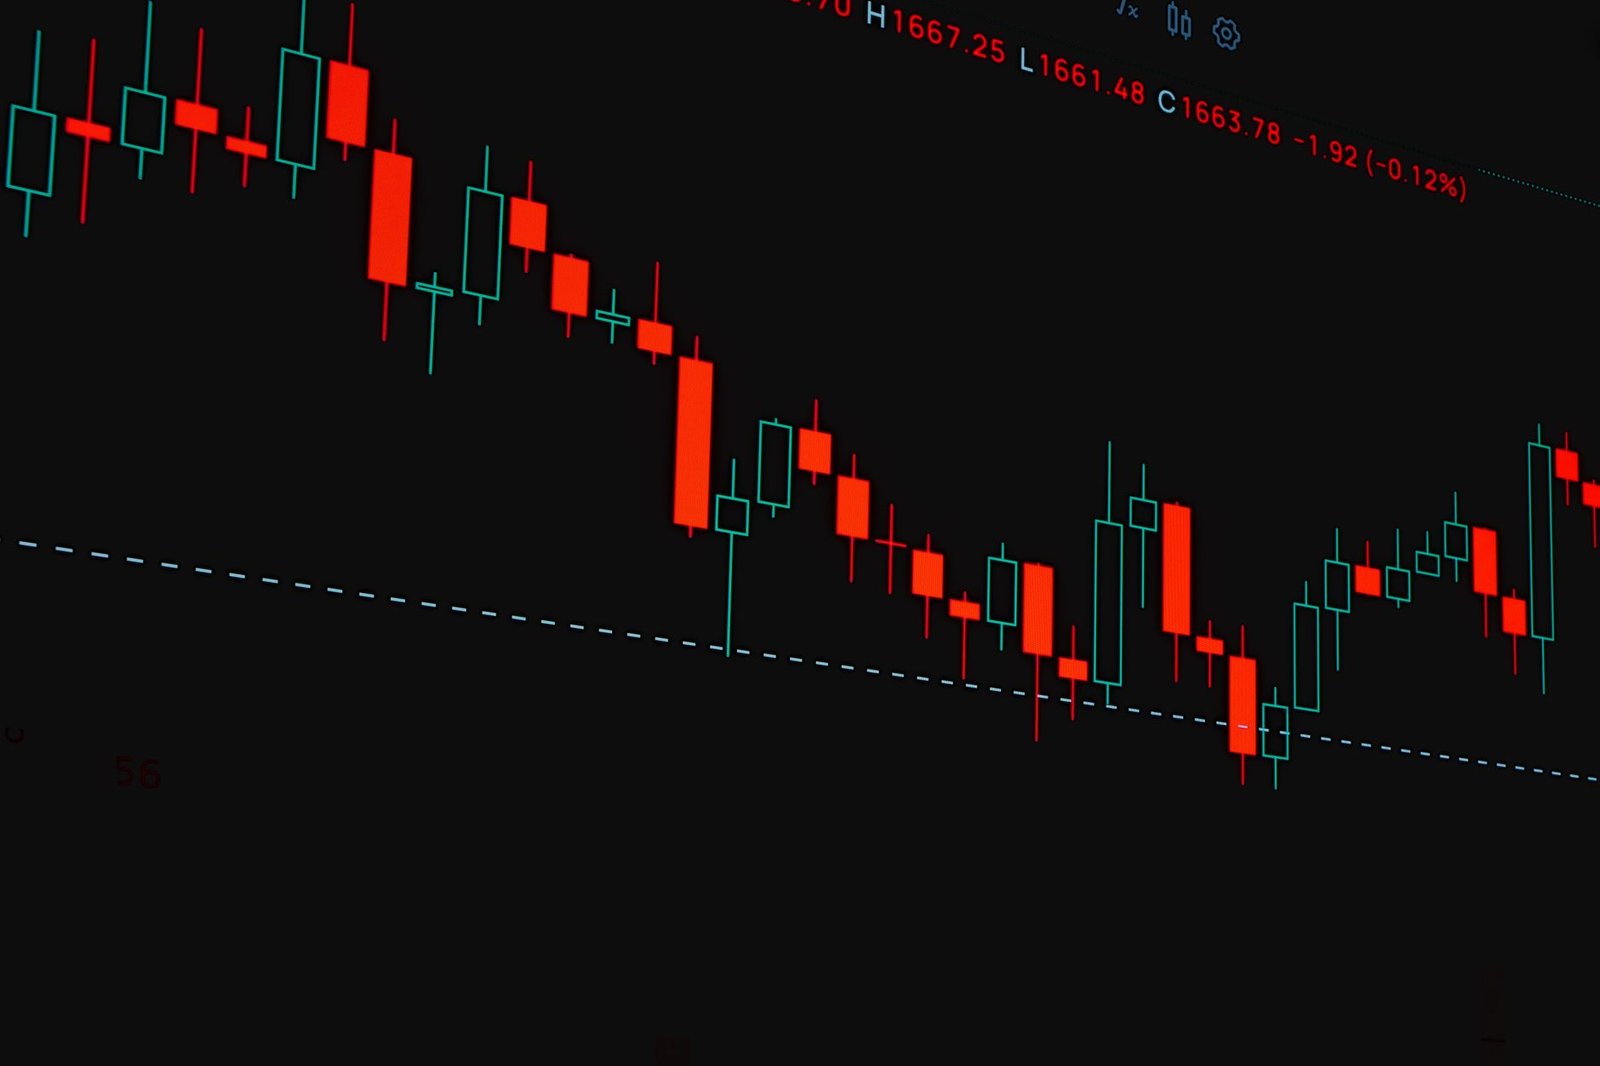
Candlestick patterns are visual representations of price movements within a specific timeframe. They provide insights into market sentiment and potential future price direction. Common bullish patterns include the Hammer and Bullish Engulfing, while bearish patterns include the Shooting Star and Bearish Engulfing. Recognizing these can help in timing entries and exits.
Leveraging Moving Averages
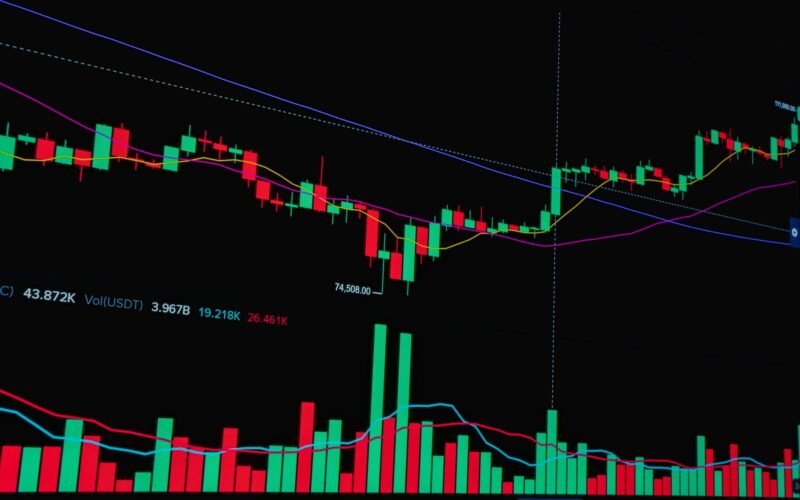
Moving averages (MAs) smooth out price data to create a single flowing line, making it easier to identify the direction of a trend. Simple Moving Averages (SMAs) and Exponential Moving Averages (EMAs) are widely used. Crossovers between short-term and long-term MAs, like the 50-day and 200-day MA, are often interpreted as buy or sell signals.
The Power of Volume Analysis
Volume represents the number of shares traded during a specific period. High volume accompanying a price move often confirms the strength of that move. For example, a breakout above resistance on significantly higher volume is a stronger signal than one on low volume. Conversely, declining volume during a trend might indicate weakening momentum.
Using Oscillators and Indicators
Oscillators like the Relative Strength Index (RSI) and Stochastic Oscillator help identify overbought or oversold conditions in the market. Indicators such as the Moving Average Convergence Divergence (MACD) can signal changes in momentum and trend direction. These tools, when used in conjunction, provide a more robust signal.
Chart Patterns and Trendlines
Traders identify patterns like Head and Shoulders, Double Tops/Bottoms, Triangles, and Flags/Pennants on price charts. These patterns often suggest potential trend reversals or continuations. Trendlines, drawn by connecting a series of price highs or lows, help define the trend’s direction and potential support/resistance zones.
What is Fundamental Analysis in the Indian Context?
Fundamental analysis in the Indian context involves evaluating a company’s intrinsic value by examining its financial health, management quality, competitive position, and economic environment, rather than short-term market fluctuations.
While technical analysis focuses on price action, fundamental analysis delves into the underlying business. For long-term investors in the Indian market, this is paramount. It involves scrutinizing financial statements, understanding the business model, assessing the quality of management, and evaluating the industry landscape. SEBI regulations require companies to disclose detailed financial reports, which are essential resources for this type of analysis.
Examining Financial Statements
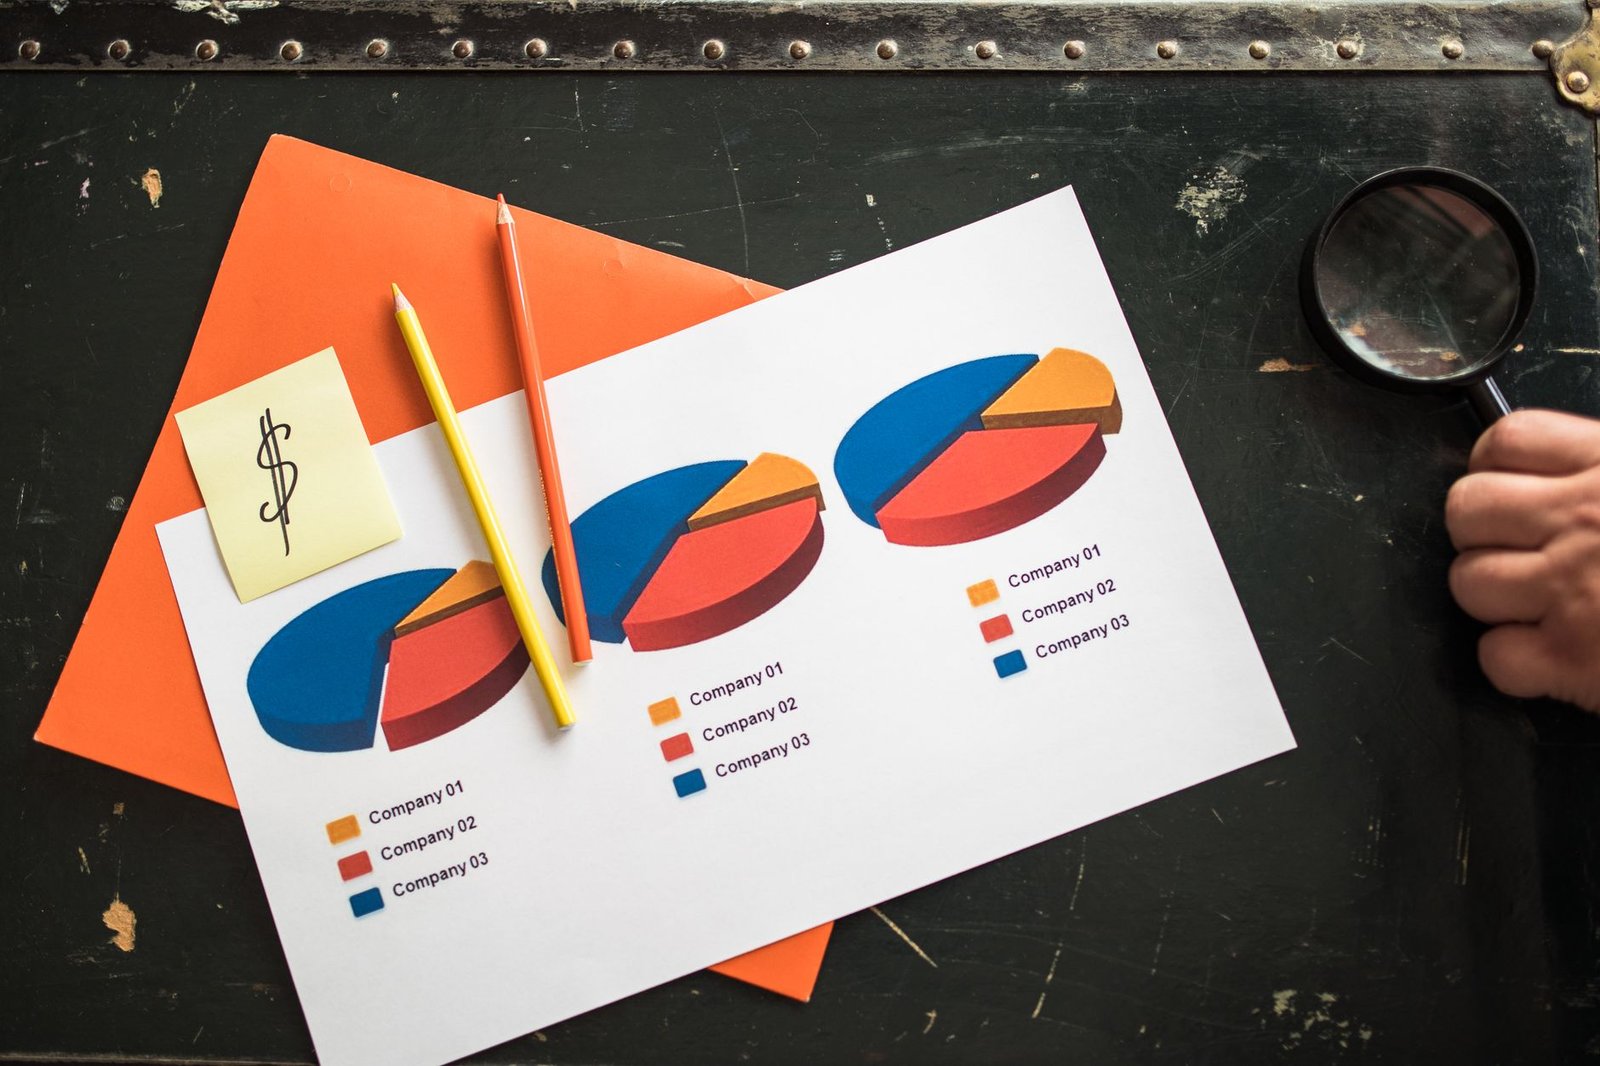
Key financial statements include the Balance Sheet, Income Statement, and Cash Flow Statement. Analyzing ratios like the Price-to-Earnings (P/E) ratio, Debt-to-Equity ratio, Return on Equity (ROE), and Profit Margins helps gauge a company’s financial health and profitability. For instance, a consistently high ROE for a manufacturing company might indicate efficient operations.
Assessing Management Quality and Corporate Governance
The quality and integrity of a company’s management team are critical. Investors look for experienced leadership, a clear strategic vision, and a track record of ethical corporate governance. Red flags include frequent management changes, related-party transactions that aren’t arm’s length, or a history of accounting irregularities.
Understanding Industry and Competitive Landscape
A company’s performance is heavily influenced by its industry dynamics and competitive environment. Analyzing the industry’s growth prospects, regulatory landscape (often influenced by government policies and SEBI directives), and the company’s competitive advantages (moats) is crucial. Is the company a market leader, or is it facing intense competition?
Evaluating Economic Moats
Economic moats are sustainable competitive advantages that protect a company’s long-term profits and market share from competitors. These can include strong brand recognition, network effects, intellectual property, cost advantages, or high switching costs for customers. Identifying companies with wide economic moats is a hallmark of successful long-term investing.
How to Analyze the Indian Stock Market: A Step-by-Step Approach
To analyze the Indian stock market like a pro, follow these steps: start with macro-economic overview, then filter for industries, select fundamentally strong companies, apply technical analysis for entry/exit, and continuously monitor performance and news.
Combining both fundamental and technical analysis, along with an understanding of the broader economic picture, provides a robust framework for making investment decisions in the Indian market.
- Understand the Macroeconomic Environment: Assess key Indian economic indicators such as GDP growth, inflation rates (CPI, WPI), interest rate trends set by the Reserve Bank of India (RBI), and government fiscal policies. Also, consider global economic factors that might impact India.
- Identify Promising Sectors/Industries: Based on macroeconomic trends and government initiatives (like ‘Make in India’ or PLI schemes), identify sectors poised for growth. For example, if the government is focusing on infrastructure, construction and engineering sectors might be attractive.
- Perform Fundamental Analysis on Companies: Within chosen sectors, select companies with strong fundamentals. Analyze their financial statements, management quality, competitive position, and valuation metrics (P/E, P/B, ROE). Look for companies with a clear growth strategy and sustainable competitive advantages. Our Trend Traders Tool can assist in screening for such opportunities.
- Apply Technical Analysis for Entry and Exit Points: Once fundamentally sound stocks are identified, use technical analysis to pinpoint optimal entry and exit points. Look for bullish chart patterns, support levels, positive moving average crossovers, and supportive volume. Use indicators like RSI and MACD to confirm signals.
- Monitor News and Sentiment: Stay updated with company-specific news, industry developments, and overall market sentiment. This includes tracking FII/DII (Domestic Institutional Investor) flows, news related to SEBI regulations, and geopolitical events that might influence the market.
- Risk Management: Always implement risk management strategies. Determine appropriate stop-loss levels based on technical analysis and position sizing to limit potential losses. Never invest more than you can afford to lose.
- Review and Rebalance: Periodically review your portfolio’s performance and rebalance your holdings as needed based on changing market conditions or your investment goals.
Is Technical Analysis Sufficient for Investing in India?
No, technical analysis alone is generally not sufficient for long-term investing in India; it’s best used in conjunction with fundamental analysis to identify potential entry and exit points for fundamentally strong companies.
While technical analysis excels at timing market entries and exits and identifying short-term trends, it doesn’t provide insight into a company’s intrinsic value or long-term business prospects. Relying solely on technicals can lead to investing in weak companies or missing out on fundamentally sound businesses that may be temporarily out of favour technically. A holistic approach, integrating both disciplines, is what professionals often employ.
Key Considerations for Retail Traders
Retail traders should focus on understanding core concepts, managing risk diligently, and avoiding herd mentality. Start with a few reliable indicators and patterns, and gradually expand your knowledge base. Consider utilizing advanced tools and resources to enhance your trading capabilities.
The Role of Market Sentiment
Market sentiment, often referred to as the ‘mood’ of the market, can significantly impact stock prices, especially in the short term. Fear and greed are powerful drivers. Understanding sentiment through news, social media trends, and investor surveys can provide an edge, but it’s often volatile and unpredictable.
Utilizing Financial News and Data
Reliable financial news sources (e.g., Business Standard, Economic Times) and data platforms (like NSE India, BSE India websites) are invaluable. Consistent consumption of accurate information helps in building a better understanding of market dynamics and company performance.
Backtesting Trading Strategies
Before deploying capital, it’s wise to backtest your trading strategies using historical data. This helps in evaluating the potential profitability and risk of a strategy. Many trading platforms offer backtesting functionalities.
Importance of a Trading Plan
A well-defined trading plan outlines your investment objectives, risk tolerance, preferred strategies, and rules for entering and exiting trades. Sticking to this plan helps in disciplined trading and prevents emotional decision-making.
Frequently Asked Questions
What are the main stock exchanges in India?
The two primary stock exchanges in India are the National Stock Exchange (NSE) and the Bombay Stock Exchange (BSE). They are regulated by SEBI and facilitate the trading of listed securities.
How can I start analyzing stocks if I’m a beginner?
Beginners should start by understanding basic financial terms, learning about fundamental and technical analysis concepts, and practicing with virtual trading or small amounts. Focus on learning about well-established companies first.
What is the P/E ratio and why is it important?
The Price-to-Earnings (P/E) ratio compares a company’s stock price to its earnings per share. It helps investors gauge whether a stock is overvalued or undervalued relative to its earnings potential and industry peers.
How often should I review my stock portfolio?
For active traders, daily or weekly reviews might be necessary. For long-term investors, monthly or quarterly reviews are generally sufficient, unless significant market events occur.
What is FII and DII in the Indian stock market?
FII stands for Foreign Institutional Investor, and DII stands for Domestic Institutional Investor. Their buying and selling activities significantly influence market direction due to the large capital they deploy.
Where can I find reliable Indian stock market data?
Reliable data can be found on the official websites of NSE India and BSE India, SEBI’s website, and reputable financial news portals and data providers specializing in the Indian market.
Key Takeaways:
- A professional approach to analyzing the Indian stock market combines fundamental and technical analysis.
- Fundamental analysis focuses on a company’s intrinsic value and long-term prospects.
- Technical analysis helps in identifying trading patterns and timing market entries/exits.
- Macroeconomic factors and market sentiment play a crucial role in price movements.
- Risk management and a disciplined trading plan are essential for success.
- Continuous learning and adaptation to market dynamics are key for traders and investors.
- Utilizing tools like TradingView indicators and specialized platforms can enhance analysis capabilities.
Investment in securities markets is subject to market risks. Read all the related documents carefully before investing.





 Finovatives