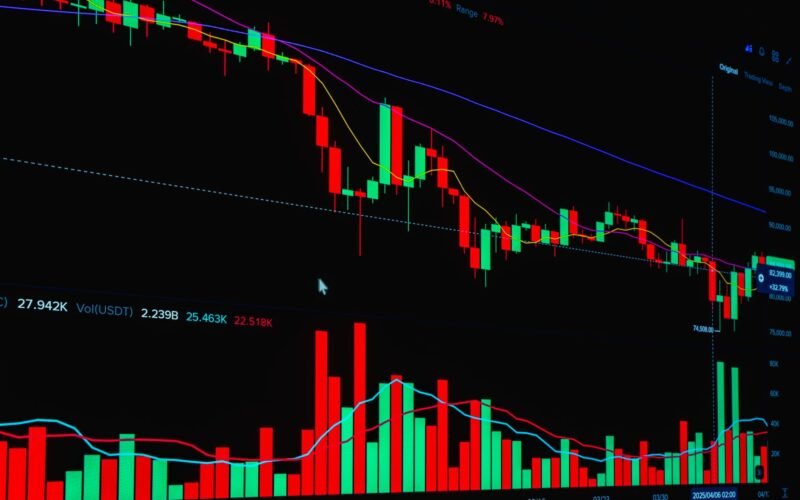


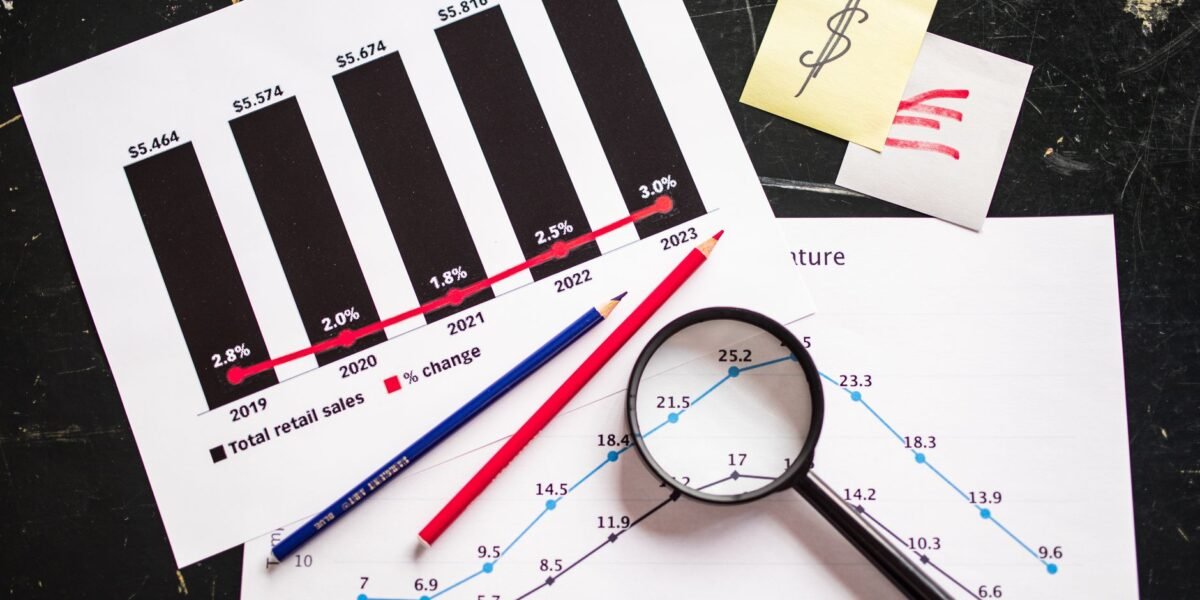
TL;DR: Market cycles on the NSE and BSE are predictable patterns of boom and bust driven by economic factors and investor sentiment, and understanding them allows traders to time their entries and exits for potentially higher profits.
Key Stats at a Glance:
- Nifty 50’s average annualised return (approx. 2000-2023): ~12%
- BSE Sensex’s inception date: January 1, 1986
- SEBI mandated rolling settlement period: T+1 day
- Number of companies listed on NSE (as of early 2024): ~2,000+
- Average duration of a full market cycle (highly variable): 5-7 years
What are Market Cycles on the NSE and BSE?
Market cycles on the Indian stock exchanges like the NSE (National Stock Exchange) and BSE (Bombay Stock Exchange) refer to the recurring, but not perfectly timed, patterns of expansion and contraction in stock prices and trading volumes over time.
The Four Phases of a Market Cycle
Every market cycle, whether in the broad indices like the Nifty 50 or BSE Sensex, or in individual stocks, generally progresses through four distinct phases. Recognising which phase the market is currently in is paramount for adapting trading strategies.
1. Accumulation (Expansion)
This phase typically follows a market trough. Prices begin to stabilise and then gradually trend upwards. Investor confidence slowly returns, and smart money or institutional investors often start accumulating positions at relatively lower prices, anticipating a future rally. Volume may be moderate but increasing.
2. Mark-Up (Bull Market)
This is the expansionary phase where prices rise significantly, driven by increasing investor optimism and positive economic news. More investors jump in, attracted by rising prices and the potential for quick profits. Trading volumes are typically high, and the trend is strongly upwards. This phase can last for months or even years.
3. Distribution (Peak)
As the market reaches its peak, a period of consolidation and uncertainty often sets in. Prices may fluctuate within a range, and upward momentum slows. While some investors continue to buy, anticipating further gains, experienced traders and institutions may begin to cautiously distribute their holdings, selling at elevated prices. Volume can be mixed, sometimes high during sharp rallies, but often showing signs of exhaustion.
4. Mark-Down (Bear Market)
This is the contractionary phase, characterised by falling prices. Investor sentiment shifts from optimism to pessimism and fear. Significant selling pressure emerges as investors rush to exit positions to limit losses. Trading volumes can be very high during sharp sell-offs. This phase continues until prices fall to a point where new buying interest emerges, signalling the start of the next accumulation phase.
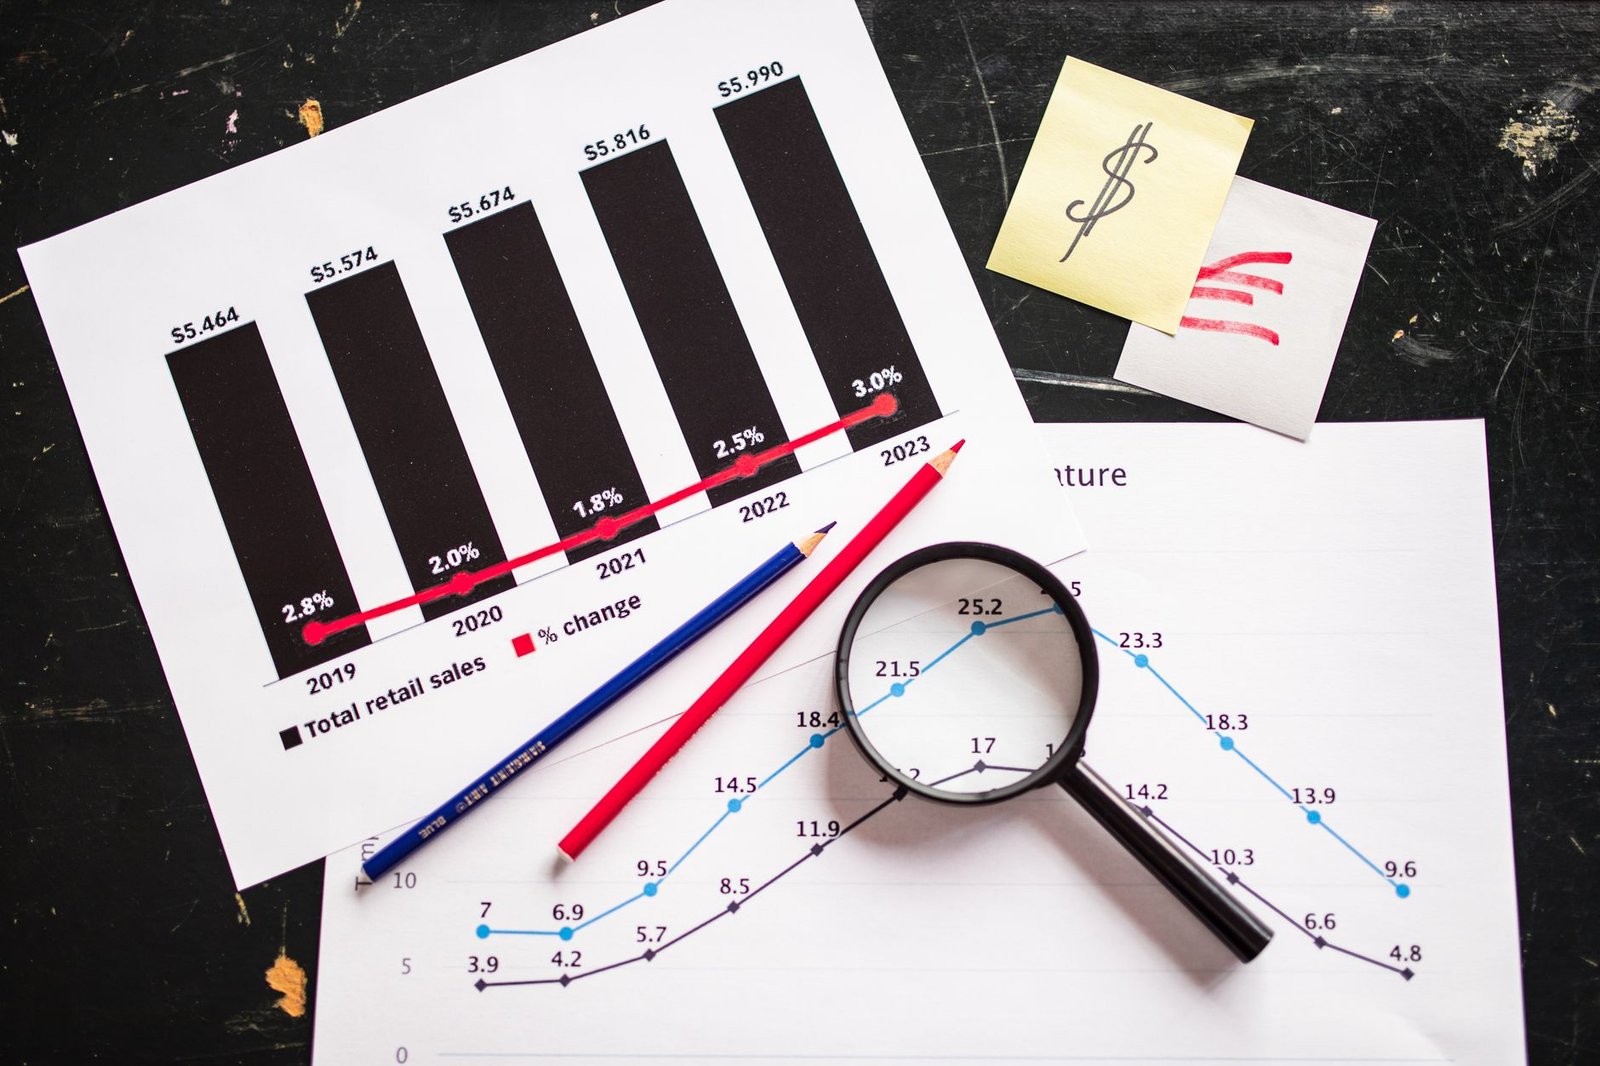
Why is Understanding Market Cycles Important for Indian Traders?
Understanding market cycles on the NSE and BSE is crucial because it allows traders and investors to align their strategies with the prevailing market conditions, leading to more informed decisions and potentially better risk-adjusted returns.
Adapting Trading Strategies
Different trading strategies perform optimally in different market phases. For instance, trend-following strategies work best during strong mark-up or mark-down phases, while range-bound or mean-reversion strategies might be more effective during distribution or accumulation phases. Ignoring the cycle can lead to using inappropriate tools and strategies, resulting in losses.
Timing Entries and Exits
One of the most significant benefits of understanding market cycles is improved timing for entering and exiting trades. Buying during the accumulation phase and selling during the distribution phase can maximise profit potential. Conversely, short-selling during the mark-down phase can also be profitable if executed correctly. Attempting to catch a falling knife or selling too early in a bull run are common mistakes that cycle awareness helps avoid.
Risk Management
Market cycles are intrinsically linked to volatility and risk. The mark-down phase, for example, often sees heightened volatility and significant downside risk. By identifying the current phase, traders can adjust their position sizing, stop-loss levels, and overall risk exposure. A trader might significantly reduce leverage or even move to defensive assets during a perceived mark-down phase.
Psychological Preparedness
Market sentiment plays a huge role in driving cycles. Fear and greed are powerful emotions that often lead to irrational decision-making. Understanding that markets move in cycles helps traders remain psychologically prepared for both euphoric rallies and sharp downturns, preventing them from being overly influenced by short-term price movements or herd mentality.
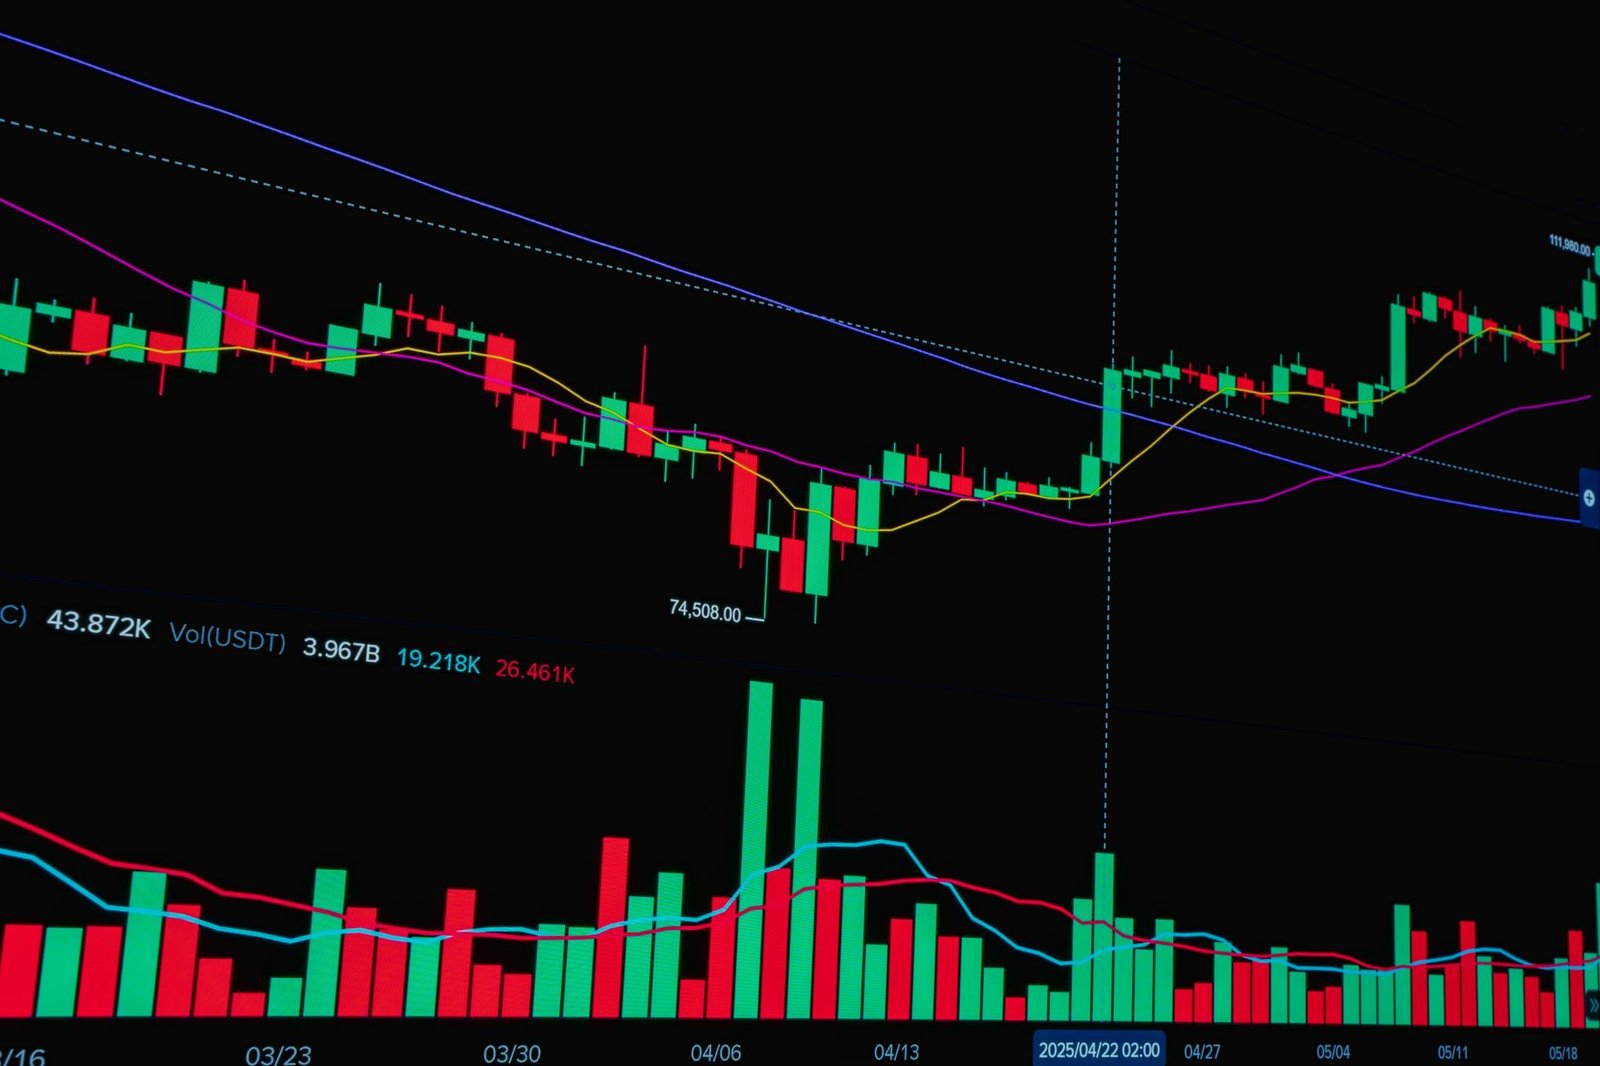
How to Identify Market Cycles on NSE and BSE
Identifying market cycles involves a combination of technical analysis, fundamental analysis, and sentiment indicators. While no method is foolproof, combining these approaches can significantly improve your ability to gauge the market’s current phase.
Here’s a practical approach:
- Analyse Major Index Trends: Examine the long-term charts of key indices like the Nifty 50 and BSE Sensex. Look for established uptrends, downtrends, or periods of consolidation. Identify higher highs and higher lows (bullish trend) or lower highs and lower lows (bearish trend).
- Study Moving Averages: Use long-term moving averages (e.g., 200-day or 1-year Simple Moving Average) on index charts. When the price is consistently above the moving average, it often indicates an uptrend (mark-up phase). When it’s consistently below, it suggests a downtrend (mark-down phase). Crossovers and the slope of the moving average provide further clues.
- Monitor Economic Indicators: Keep an eye on macroeconomic data released by the Reserve Bank of India (RBI) and the government. GDP growth, inflation rates, interest rate changes, and manufacturing/services PMI data can provide fundamental context for the market’s direction. Strong economic growth usually supports mark-up phases, while slowdowns can precede mark-down phases.
- Assess Investor Sentiment: Gauge market sentiment through indicators like the India VIX (volatility index), Put-Call Ratio (PCR), and news flow. Extremely high VIX or extremely low PCR often signals market tops (distribution), while very low VIX and high PCR can indicate market bottoms (accumulation).
- Observe Volume Patterns: Analyse trading volumes on major indices and leading stocks. Increasing volume accompanying price rises is typical of a mark-up phase. Declining volume during rallies or increasing volume during declines can signal weakness or a trend reversal.
- Look for Sector Rotation: Notice which sectors are performing well and which are lagging. During an expansion, cyclicals might lead. As the cycle matures, defensives might gain traction. This rotation can offer clues about the evolving economic landscape and market expectations.
- Consider Earnings Growth: Corporate earnings growth is a primary driver of stock prices in the long run. A sustained period of strong earnings growth supports a bull market, while deteriorating earnings can signal a coming downturn.
The Role of Technical and Fundamental Analysis
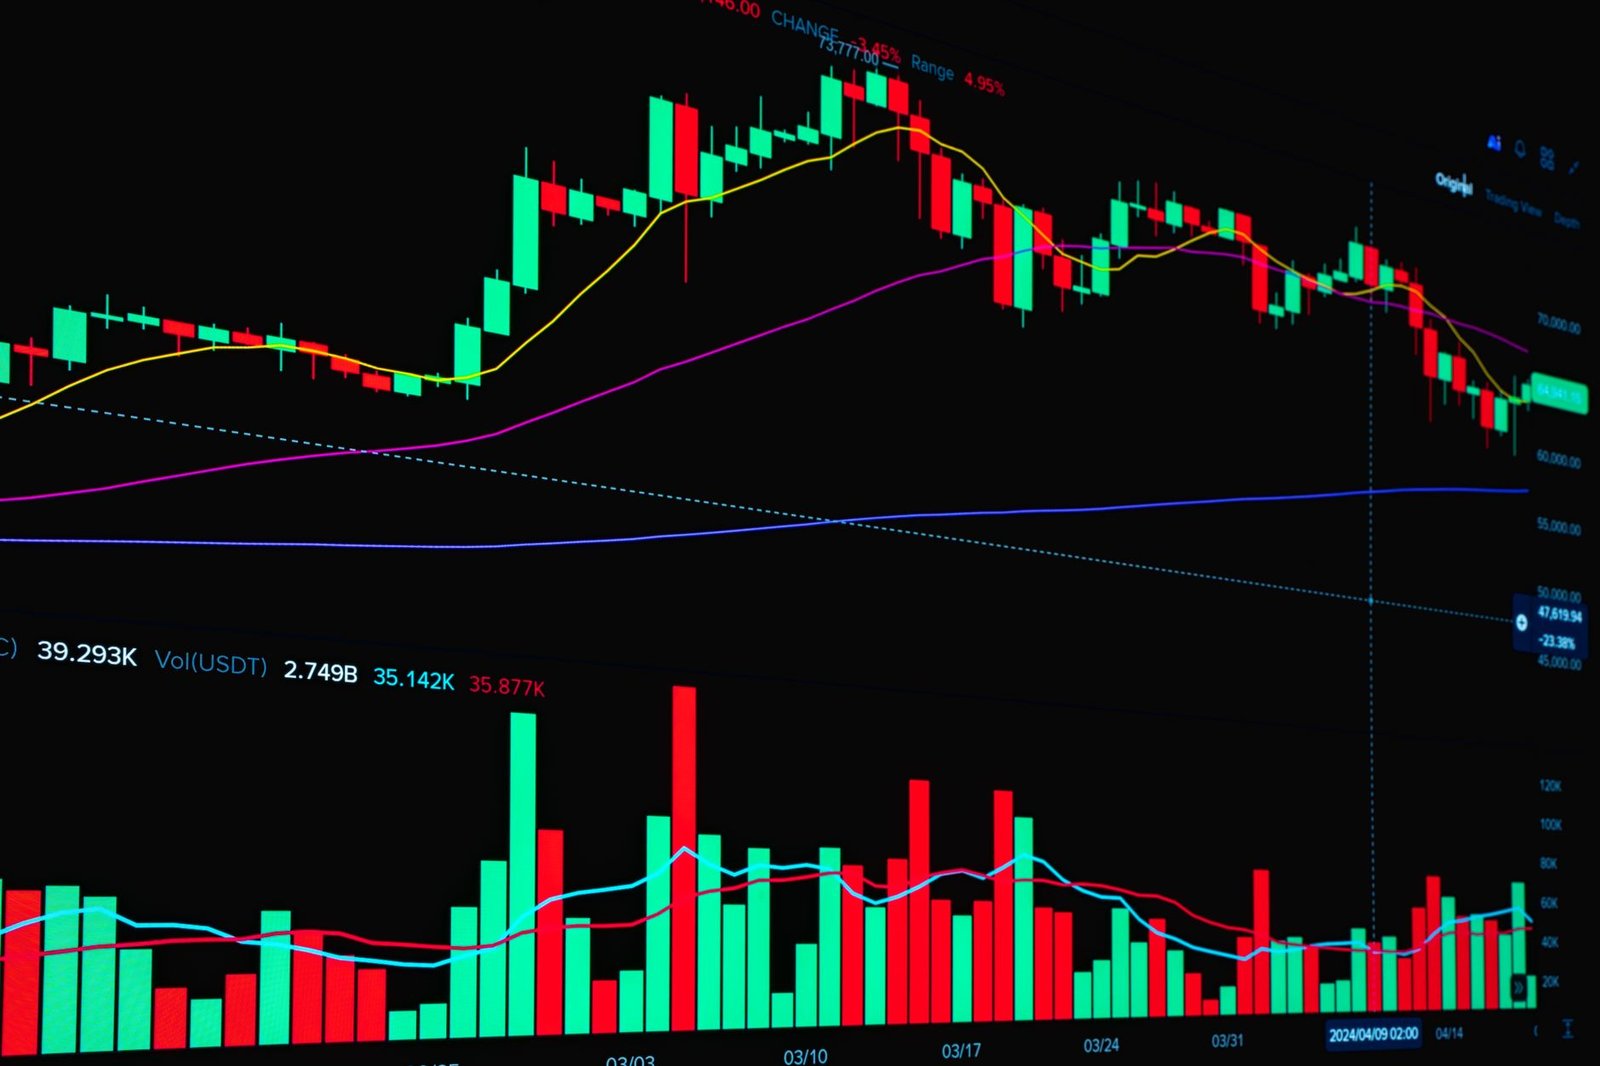
Technical analysis, which involves studying price charts and trading volumes, is invaluable for identifying the *timing* and *patterns* of cycles. Tools like trendlines, support/resistance levels, and chart patterns help traders visualise the current phase. Fundamental analysis, on the other hand, provides the *why* behind the cycle, looking at economic health, industry trends, and company valuations. A comprehensive view integrates both.
Beware of False Signals
It’s crucial to remember that market cycles are not perfectly predictable. False signals can occur, and trends can change unexpectedly. Therefore, always use risk management techniques like stop-losses and position sizing. Relying solely on cycle identification without risk controls is a recipe for disaster.
Key Indicators for Cycle Identification
Several indicators, when used in conjunction, can help traders identify which phase of the market cycle the NSE and BSE might be in. These tools provide data-driven insights that complement observational analysis.
1. Economic Cycle Indicators
Macroeconomic data points such as Gross Domestic Product (GDP) growth rates, inflation figures, interest rate trends set by the RBI, and Purchasing Managers’ Index (PMI) surveys offer a glimpse into the broader economic health, which directly influences market cycles.
2. Investor Sentiment Indicators
The India VIX (Volatility Index) is a key indicator reflecting market expectations of volatility over the next 30 days. A rising VIX often signals fear and potential downtrend, while a falling VIX suggests complacency or a stable uptrend. The Put-Call Ratio (PCR) from the derivatives market also indicates sentiment; a very low PCR can suggest excessive bearishness (potential bottom), and a very high PCR can indicate excessive bullishness (potential top).
3. Technical Indicators
Beyond moving averages, indicators like the Relative Strength Index (RSI) can show overbought/oversold conditions, potentially signalling turning points. The MACD (Moving Average Convergence Divergence) can help identify trend strength and potential reversals. Analysing these on longer timeframes (weekly, monthly) is more effective for cycle identification than on intraday charts.
4. Volume Analysis
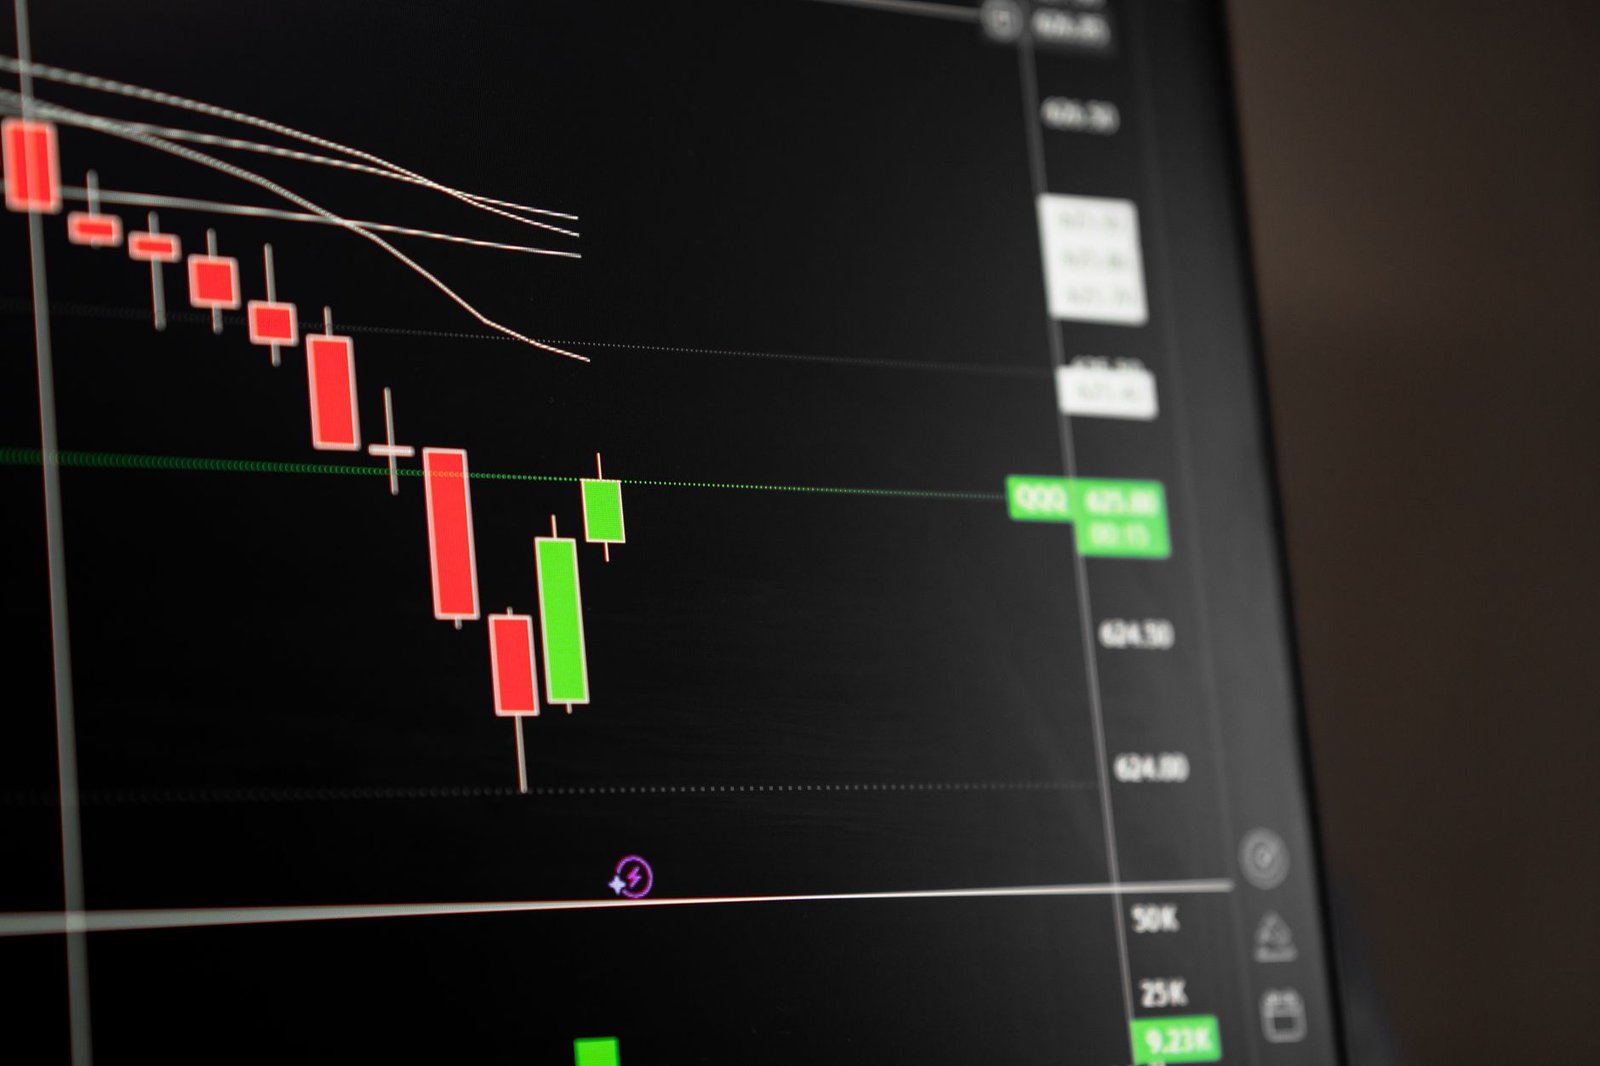
Volume is often called the ‘blood’ of the market. Examining volume patterns alongside price action is critical. For example, a strong rally on low volume might be suspect, while a sharp decline on very high volume confirms strong selling pressure. Accumulation phases often show increasing volume on up days and decreasing volume on down days, while distribution might show the opposite.
5. Fundamentally Driven Indicators
Changes in corporate earnings forecasts, dividend payout trends, and analyst ratings can provide forward-looking insights. A consistent downgrading of earnings expectations across multiple sectors could signal an upcoming economic slowdown and a potential market downturn.
Frequently Asked Questions
What is the primary driver of market cycles?
Market cycles are driven by a complex interplay of economic factors (like interest rates, GDP growth, inflation), corporate earnings, investor psychology (fear and greed), and major global or domestic events.
How long does a typical market cycle last?
There is no fixed duration. A full market cycle can range from a few years to over a decade, with individual phases varying greatly in length and intensity.
Can market cycles be predicted with certainty?
No, market cycles cannot be predicted with absolute certainty. They are probabilistic patterns, and external shocks can disrupt them. Analysis aims to identify the *likely* phase.
Which phase is best for long-term investing?
The accumulation phase is often considered the most opportune for long-term investors, as assets are typically undervalued before a significant upward trend begins.
How can I use TradingView indicators to identify cycles?
Many TradingView indicators, like moving averages, MACD, and RSI, when applied to longer timeframes and used with volume analysis, can help identify trends and potential turning points characteristic of different market cycle phases.
Should I change my entire portfolio based on market cycles?
While understanding cycles can inform strategy adjustments, drastically changing a long-term investment portfolio based solely on cycle predictions is risky. Focus on strategic allocation and risk management.
Key Takeaways
- Market cycles on the NSE and BSE consist of four phases: Accumulation, Mark-Up, Distribution, and Mark-Down.
- Understanding these cycles helps traders and investors align strategies, improve timing, and manage risk effectively.
- Identifying cycles involves analysing index trends, moving averages, economic data, sentiment indicators, and volume patterns.
- Technical and fundamental analysis are complementary tools for gauging market cycles.
- Indicators like the India VIX, PCR, and long-term moving averages provide valuable insights.
- Market cycles are not perfectly predictable; robust risk management is essential.
- Adapting strategies to the prevailing cycle phase, rather than rigidly sticking to one approach, is key to navigating the markets.
Trading and investing in the stock market involve inherent risks. Past performance is not indicative of future results. Consult with a SEBI-registered financial advisor before making any investment decisions.





 Finovatives